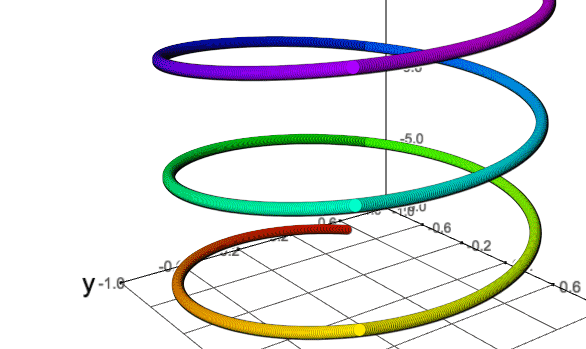
Bring the best of JavaScript data visualization to R

  • Use JavaScript visualization libraries at the R console, just like plots
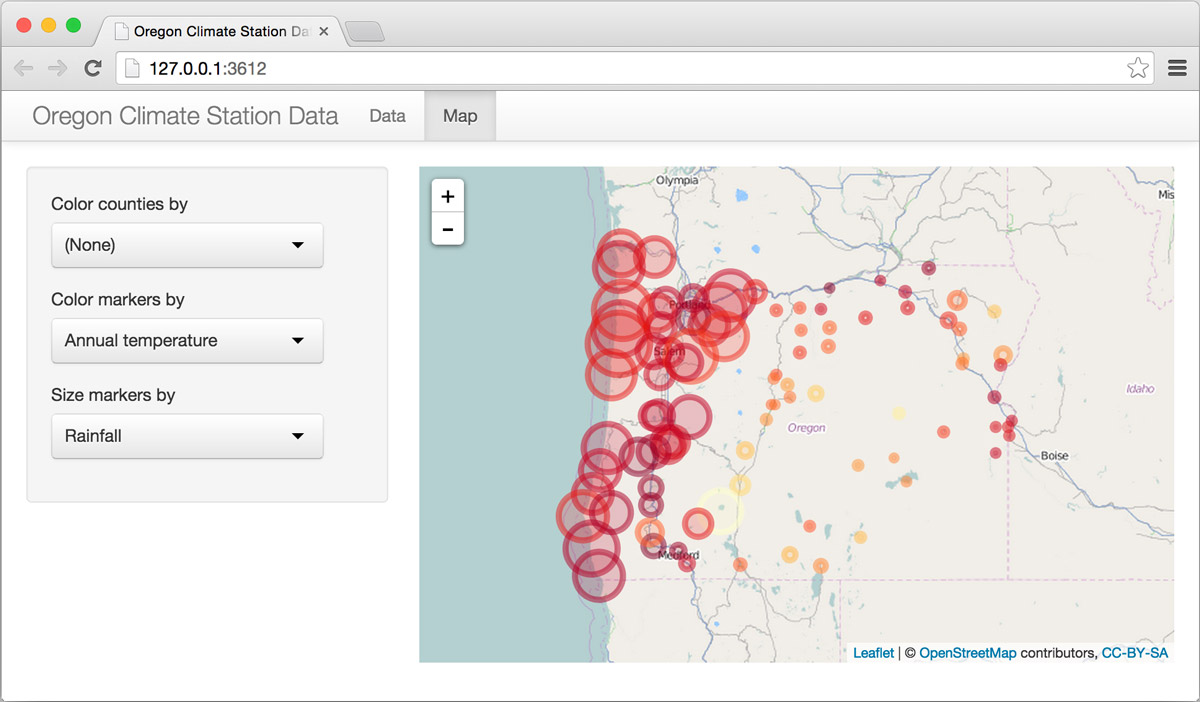
  • Embed widgets in R Markdown documents and Shiny web applications
  • Develop new widgets using a framework that seamlessly bridges R and JavaScript
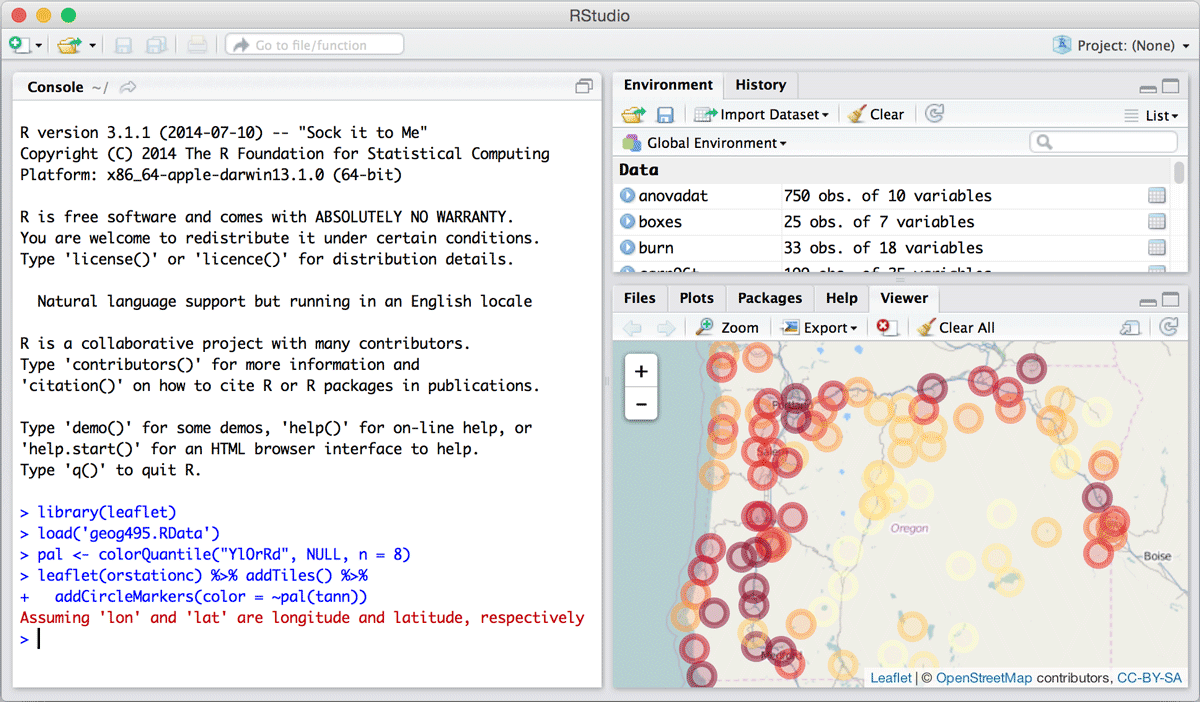
Widgets in action

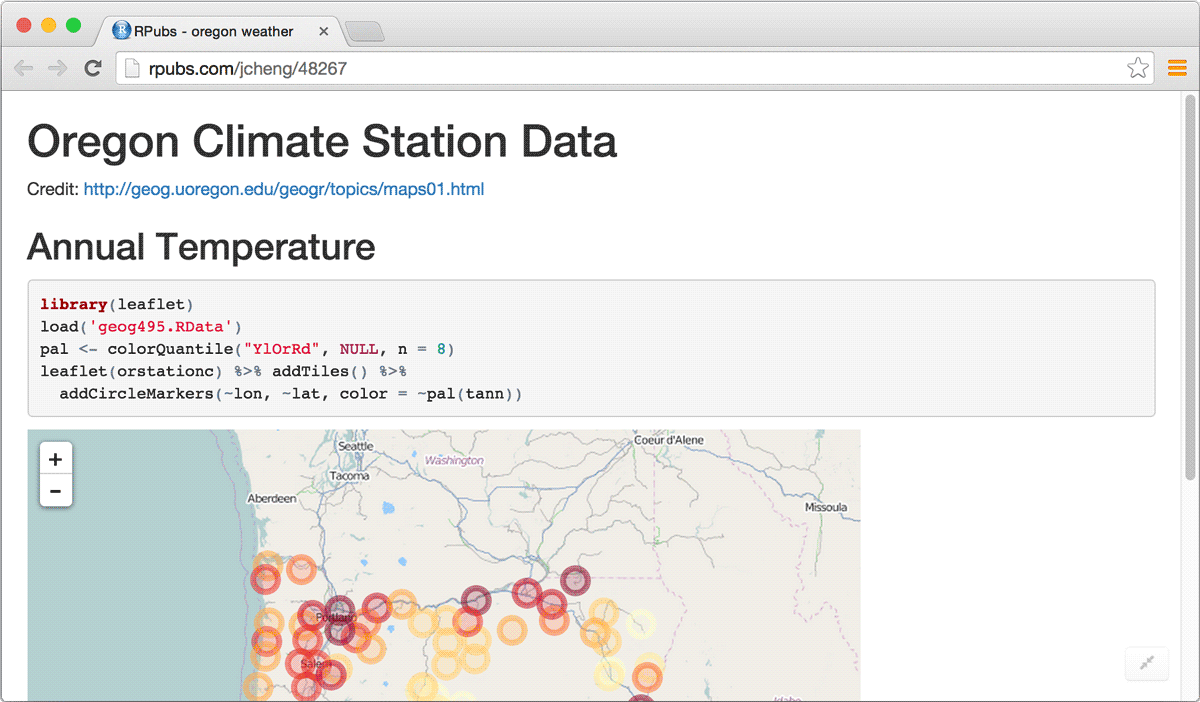
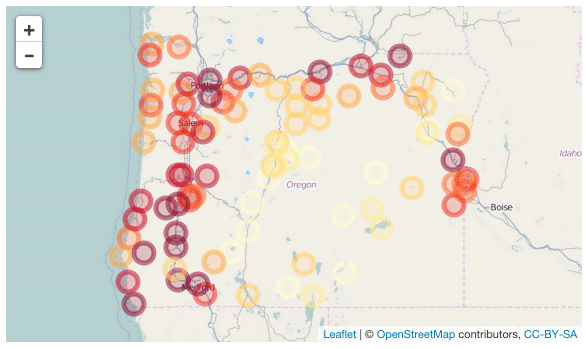
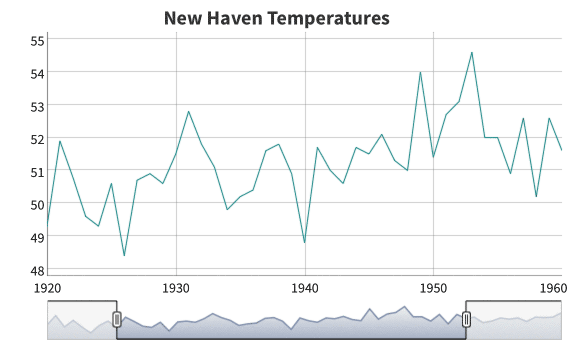
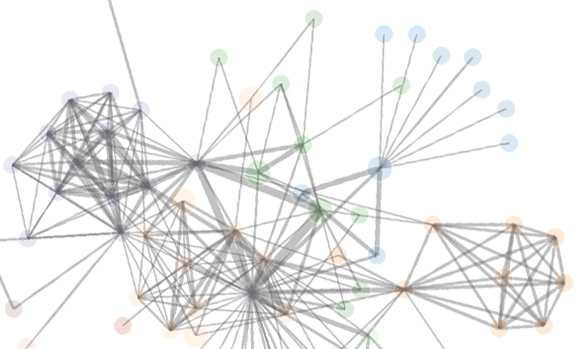
See how just a line or two of R code can be used to create interactive visualizations with Leafet (mapping), dygraphs (time-series), networkD3 (graph visualization), and more.


Creating widgets

Learn how to create an R binding for your favorite JavaScript library and enable use of it in the R console, in R Markdown documents, and in Shiny web applications.