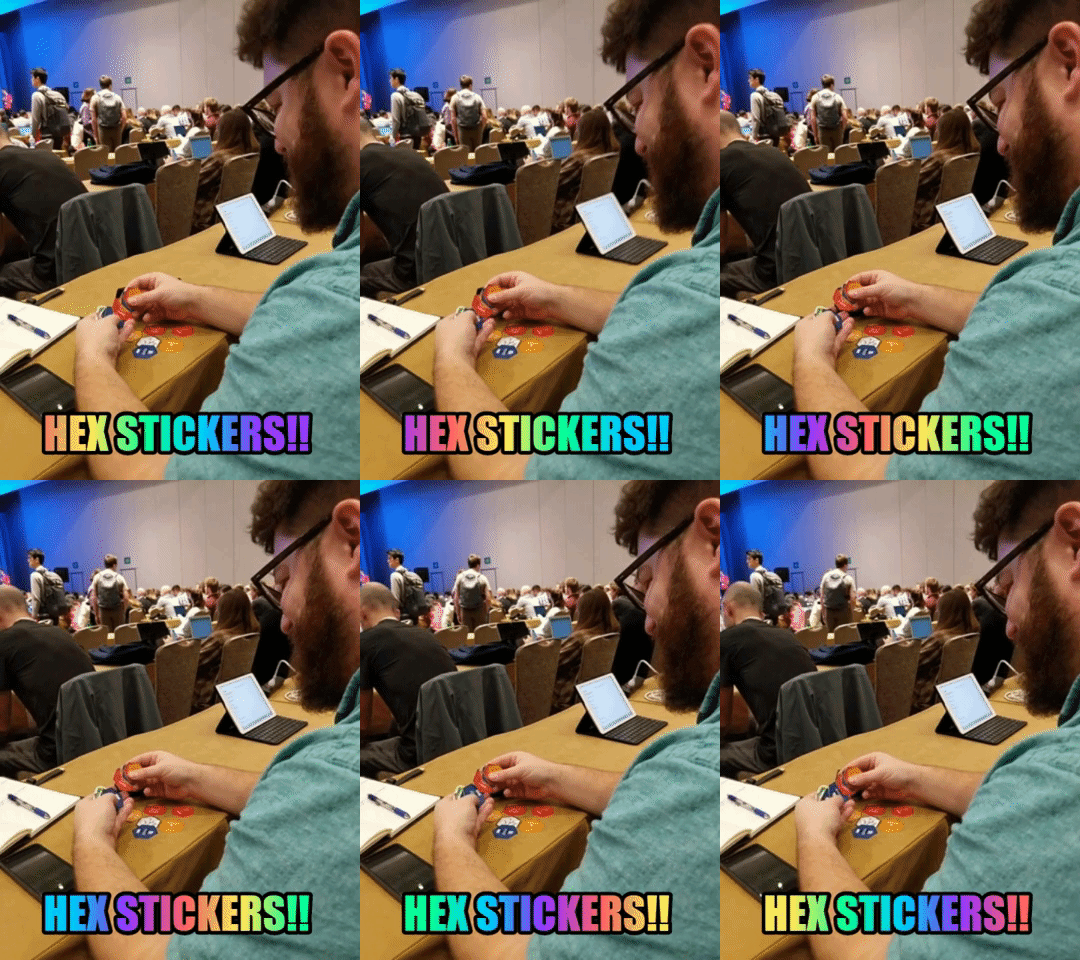
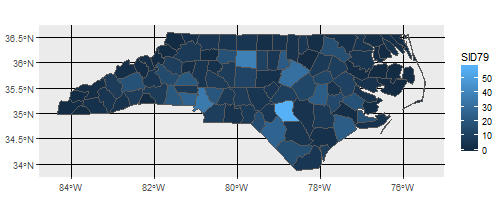
class: center, middle, inverse, title-slide # rstudio::conf 2018 ## tidy ### Sameer Tammana ### Feb 08, 2018 --- # What was the conference about really? -- .center[  ] --- # Tidy Session Topics -- - [Tidy spatial data analysis](https://github.com/edzer/rstudio_conf), [Edzer Pebesma](https://github.com/edzer) - [The future of time series and financial analysis in the tidyverse](https://github.com/business-science/presentations/tree/master/2018_02_02_rstudio-conf-2018/presentation), [Davis Vaughan](https://github.com/DavisVaughan?tab=repositories), [@dvaughan32](https://twitter.com/dvaughan32) - [infer: a package for tidy statistical inference](http://bit.ly/2DYoBOz), [Andrew Bray](http://infer.netlify.com/) - [Tidying up your network analysis with tidygraph and ggraph](https://www.data-imaginist.com/slides/rstudioconf2018/assets/player/keynotedhtmlplayer#0), [Thomas Lin Pedersen](https://github.com/thomasp85), [@thomasp85](https://twitter.com/thomasp85) - [The lesser known stars of the tidyverse](https://github.com/robinsones/rstudio-conf-2018-talk), [Emily Robinson](https://robinsones.github.io/), [@robinson_es](https://twitter.com/robinson_es) -- - [Augmenting data exploration with interactive graphics](https://talks.cpsievert.me/20180202), [Carson Sievert](http://cpsievert.me/), [@cpsievert](http://twitter.com/cpsievert/) - [tidycf: Turning analysis on its head by turning cashflows on their sides](https://github.com/emilyriederer/references/blob/master/tidycf_Riederer_rstudio.pdf), [Emily Riederer](https://popup.dominodatalab.com/chicago/speakers/emily-riederer/) - [Modeling in the tidyverse](https://github.com/topepo/rstudio-conf/tree/master/2018/Modeling_in_the_Tidyverse--Max_Kuhn), [Max Kuhn](https://github.com/topepo) -- For info about other sessions: [rstudio::conf 2018 Talks & Training Sessions](https://github.com/simecek/RStudioConf2018Slides) --- # Tidy Spatial Data Analysis ## Package `sf` features -- - `sf` objects extends the `data.frame` or `tbl_df` with a geometry list-column - speeds up geometrical operations by using spatial indexes created on-the-fly - simple and small API - introduces `dplyr` verb methods for sf objects --- # Tidy Spatial Data Analysis ##geom_sf ```r library(ggplot2) # install_github("tidyverse/ggplot2") library(sf) nc = st_read(system.file("shape/nc.shp", package="sf"), quiet = TRUE) ggplot(nc) + geom_sf(aes(fill = SID79)) ``` <!-- --> --- # Future of Timeseries in Tidyverse **`tibletime`** is an extension of the tidyverse that allows for the creation of time-aware **tibbles** through the setting of a **time-index** column. -- ```r library(tibbletime) library(dplyr) # Facebook stock prices. Comes with the package data(FB) # Convert FB to tbl_time FB <- as_tbl_time(FB, index = date) head(FB,5) ``` ``` ## # A time tibble: 5 x 8 ## # Index: date ## symbol date open high low close volume adjusted ## <chr> <date> <dbl> <dbl> <dbl> <dbl> <dbl> <dbl> ## 1 FB 2013-01-02 27.4 28.2 27.4 28.0 69846400 28.0 ## 2 FB 2013-01-03 27.9 28.5 27.6 27.8 63140600 27.8 ## 3 FB 2013-01-04 28.0 28.9 27.8 28.8 72715400 28.8 ## 4 FB 2013-01-07 28.7 29.8 28.6 29.4 83781800 29.4 ## 5 FB 2013-01-08 29.5 29.6 28.9 29.1 45871300 29.1 ``` --- # Future of Timeseries in Tidyverse `filter_time`: Use a concise filtering method to filter a tbl_time object by its index. ```r # Filter for dates from March 2013 to December 2015 FB %>% filter_time("2013-03" ~ "2015") # Filter for dates in 2015 FB %>% filter_time(~"2015") # Filter for dates from the start of the timeseries to Dec 2012 FB %>% filter_time("start" ~ "2013-12") ``` --- # Future of Timeseries in Tidyverse `collapse_by` : Collapse the index so that all observations in an interval share the same date. Useful for grouping ```r FB %>% select(-symbol) %>% collapse_by("monthly") %>% group_by(date) %>% summarise_all(mean) %>% top_n(5) ``` ``` ## # A time tibble: 5 x 7 ## # Index: date ## date open high low close volume adjusted ## <date> <dbl> <dbl> <dbl> <dbl> <dbl> <dbl> ## 1 2016-07-29 119 120 118 119 23505430 119 ## 2 2016-08-31 124 125 124 124 15898735 124 ## 3 2016-09-30 128 129 128 129 17929433 129 ## 4 2016-10-31 130 131 129 130 14918305 130 ## 5 2016-11-30 121 122 119 121 30515643 121 ``` --- # Future of Timeseries in Tidyverse `rollify` : returns a rolling version of the input function, with a rolling `window` specified by the user. ```r # Perform a 5 period rolling average mean_5 <- rollify(mean, window = 5) mutate(FB, roll_mean = mean_5(adjusted)) ``` ``` ## # A time tibble: 1,008 x 9 ## # Index: date ## symbol date open high low close volume adjusted roll_mean ## <chr> <date> <dbl> <dbl> <dbl> <dbl> <dbl> <dbl> <dbl> ## 1 FB 2013-01-02 27.4 28.2 27.4 28.0 69846400 28.0 NA ## 2 FB 2013-01-03 27.9 28.5 27.6 27.8 63140600 27.8 NA ## 3 FB 2013-01-04 28.0 28.9 27.8 28.8 72715400 28.8 NA ## 4 FB 2013-01-07 28.7 29.8 28.6 29.4 83781800 29.4 NA ## 5 FB 2013-01-08 29.5 29.6 28.9 29.1 45871300 29.1 28.6 ## 6 FB 2013-01-09 29.7 30.6 29.5 30.6 104787700 30.6 29.1 ## 7 FB 2013-01-10 30.6 31.5 30.3 31.3 95316400 31.3 29.8 ## 8 FB 2013-01-11 31.3 32.0 31.1 31.7 89598000 31.7 30.4 ## 9 FB 2013-01-14 32.1 32.2 30.6 31.0 98892800 31.0 30.7 ## 10 FB 2013-01-15 30.6 31.7 29.9 30.1 173242600 30.1 30.9 ## # ... with 998 more rows ``` --- # **infer** an R package for tidy statistical inference -- - makes statistical inference tidy and transparent - dataframe in, dataframe out - compose tests and intervals with pipes - unite computational and approximation methods - reading an infer chain describes an inferential procedure --- # Simulation through Permutation <img src="infer_verbs.png" style="width: 90%" /> --- ```r library(infer) library(tidyverse) load("gss.Rda") gss %>% specify(NASA ~ party) %>% hypothesize( null = "independence")%>% generate( reps = 5000, type = "permute") %>% calculate(stat = "Chisq") %>% visualize() ``` <!-- --> --- # Tidying up your network analysis -- ## `tidygraph`: - `dplyr` verbs for working with network data except `do()` and `summarise()` - "Tidyfication" of algortihms provided by `igraph` - Unified API for all relational data structures -- ## `ggraph` - Adoption of replational data to ggplot2 - Dedicated `geoms` for nodes and edges - New faceting, guides, themes ... --- # The Lesser Known ☆s of the Tidyverse -- - `dplyr::na_if` - convert an annoying value to NA -- - `tibble::tribble` - Create tibbles using an easier to read row-by-row layout -- - `dplyr::select_if` - selection of variables. Ex: `is.numeric` to get numeric columns -- - `skimr::skim` - gives set of summary functions based on the types of columns in the data frame -- - `tidyr::unnest` - makes each element of the list its own row -- - `forcats::fct_reorder` - reordring your factor positions -- - `forcats::fct_relevel` - allows you to move any number of levels to any location -- - `reprex::reprex` - make it easy to share a small reproducible example ("reprex") --- class: center, middle # Thank You!