Differential expression analysis for studies with a 2x2 factorial design
John Blischak
Last updated: 2018-01-25
Code version: dc82382
Analayze microarray data from Zhang et al., 2012, which measured gene expression in hearts from wild type and Top2b null mice treated with doxorubicin or a control.
library("Biobase")
library("ggplot2")
library("limma")
eset <- readRDS("../data/ch04.rds")
Studies with a 2x2 factorial design (Video)
Describe the scientific question, the experimental design, and the data collected for the 2x2 factorial study.
Expression level of Top2b
Create a boxplot of the expression level of Top2b to confirm the null mice have lower levels of Top2b expression. Use pData and table to access and explore the phenotype measurements to be used in the plot.
head(fData(eset)) probe chr start end symbol ensembl
1 A_55_P2051983 chr18 62753954 62753895 Spink7 ENSMUST00000076194
2 A_52_P169082 chr11 76031955 76032014 Dbil5
3 A_30_P01028193 chr14 47982421 47982480
4 A_52_P237997 chr3 156834624 156834683 Negr1
5 A_51_P414243 chr9 121890800 121890741 C85492 ENSMUST00000084743
6 A_55_P2136348 chr9 120003293 120003352 Ccr8 ENSMUST00000048777
refseq entrez name
1 NM_001001803 408198 serine peptidase inhibitor, Kazal type 7 (putative)
2 NM_021294 13168 diazepam binding inhibitor-like 5
3 NA
4 NM_177274 320840 neuronal growth regulator 1
5 NM_153540 215494 expressed sequence C85492
6 NM_007720 12776 chemokine (C-C motif) receptor 8top2b <- exprs(eset)[fData(eset)$symbol == "Top2b", ]
head(pData(eset)) title genotype treatment
WT.PBS.r1 WT Cardiomyocytes 16hr after PBS rep1 WT PBS
WT.PBS.r2 WT Cardiomyocytes 16hr after PBS rep2 WT PBS
WT.PBS.r3 WT Cardiomyocytes 16hr after PBS rep3 WT PBS
WT.Dox.r1 WT Cardiomyocytes 16hr after doxorubicin rep1 WT Dox
WT.Dox.r2 WT Cardiomyocytes 16hr after doxorubicin rep2 WT Dox
WT.Dox.r3 WT Cardiomyocytes 16hr after doxorubicin rep3 WT Dox
rep
WT.PBS.r1 r1
WT.PBS.r2 r2
WT.PBS.r3 r3
WT.Dox.r1 r1
WT.Dox.r2 r2
WT.Dox.r3 r3d <- data.frame(pData(eset), top2b)
ggplot(d, aes(x = treatment, y = top2b, fill = genotype)) +
geom_boxplot()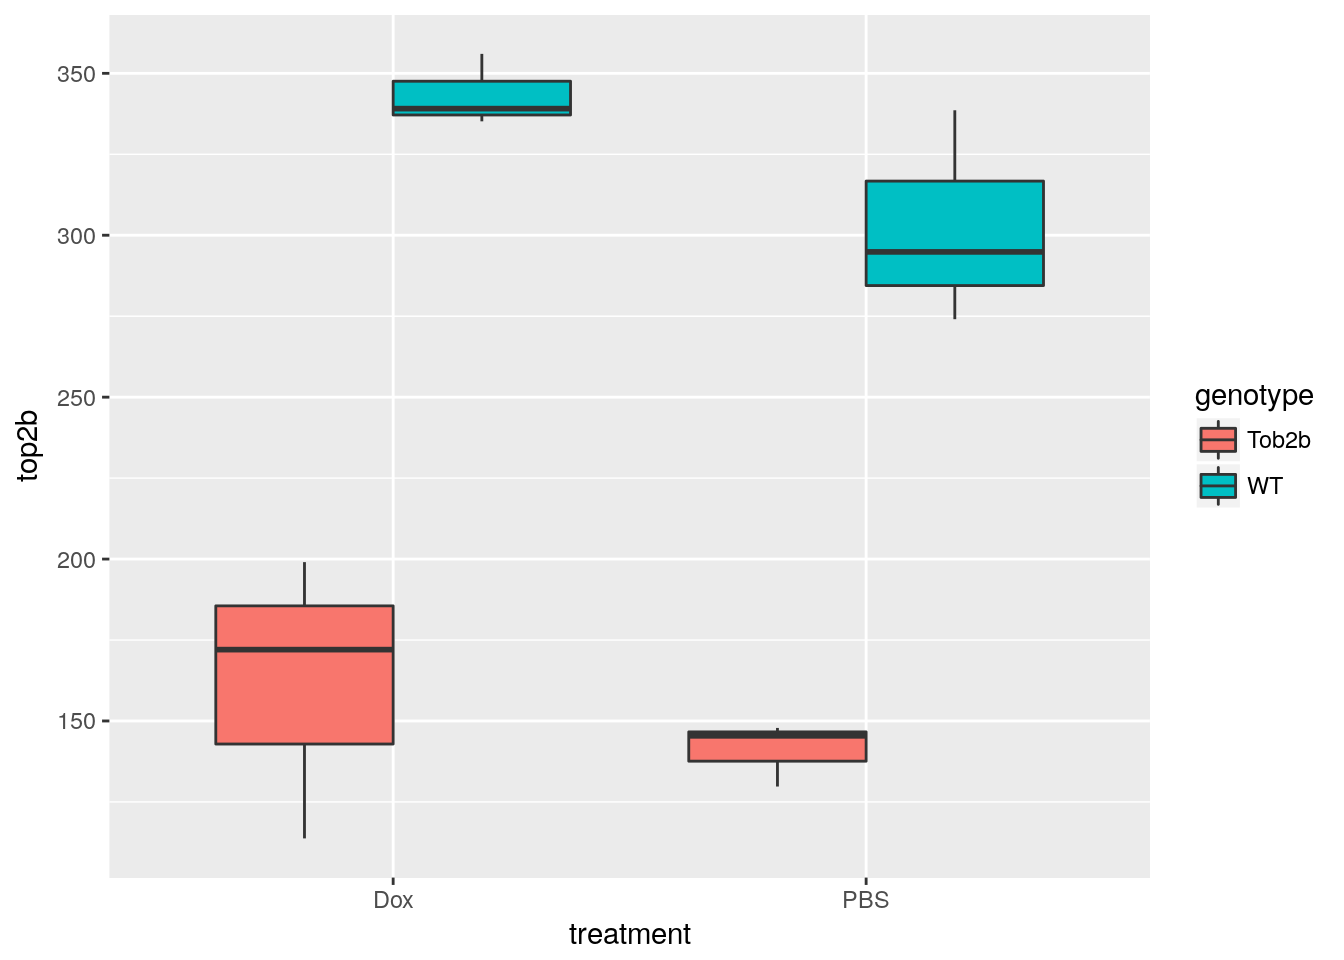
Visualize gene expression distribution with boxplots
Use boxplots as an alternative to density plots for checking the distribution of gene expression levels. Note pro (easier to see which sample belongs to each distribution) and con (hides any multimodality).
boxplot(log(exprs(eset)), las = 2)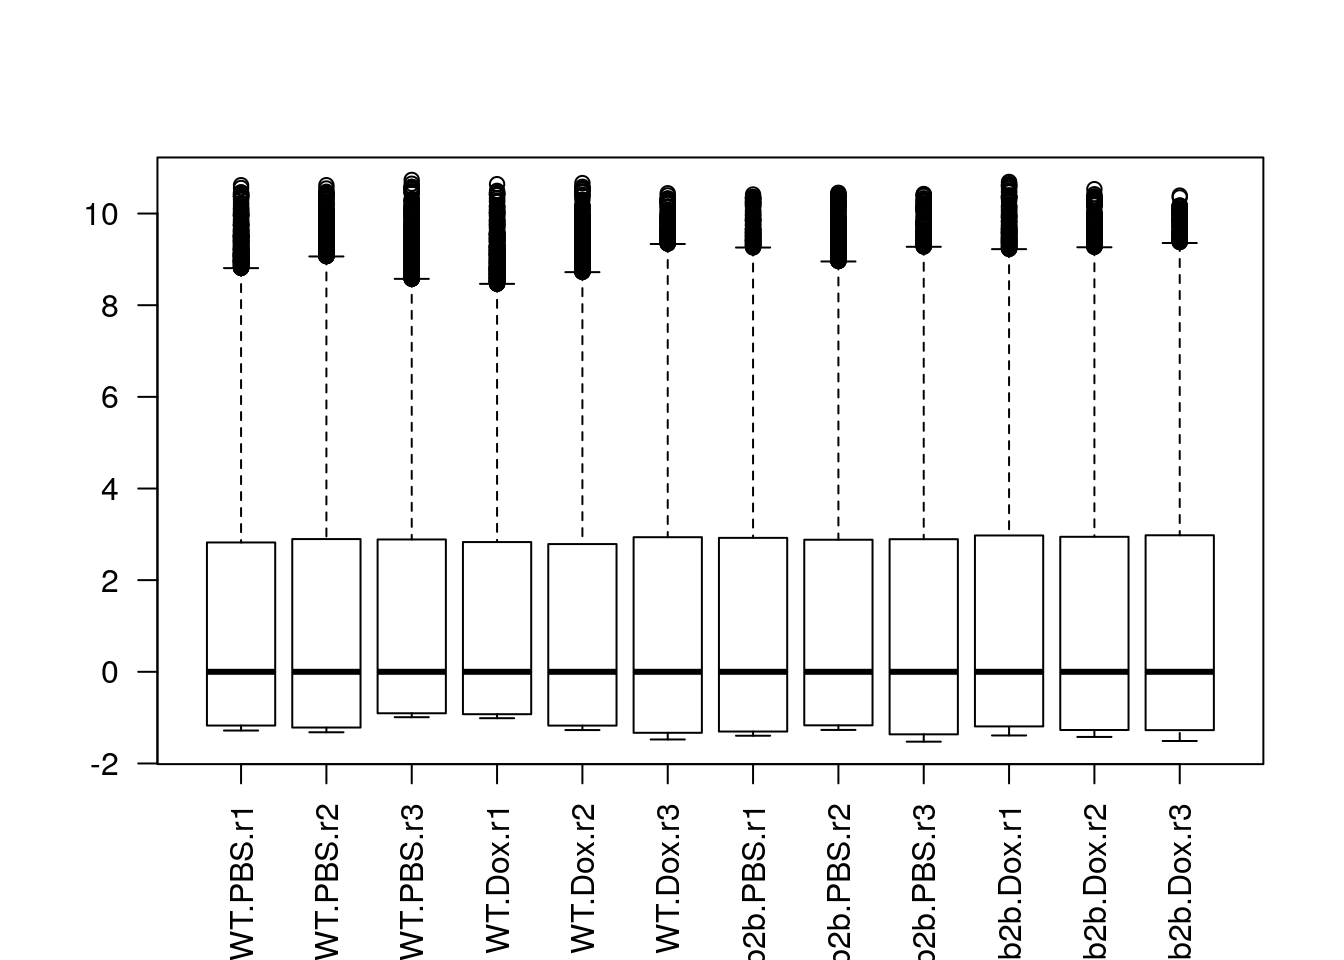
Perform PCA
Use prcomp to calculate PCs and plot PC1 vs. PC2 to confirm that the samples are separated by genotype and treatment. Note that Top2b mice all cluster with untreated WT samples since they are resistant to the treatment.
pca <- prcomp(t(exprs(eset)), scale. = TRUE)
plot(pca)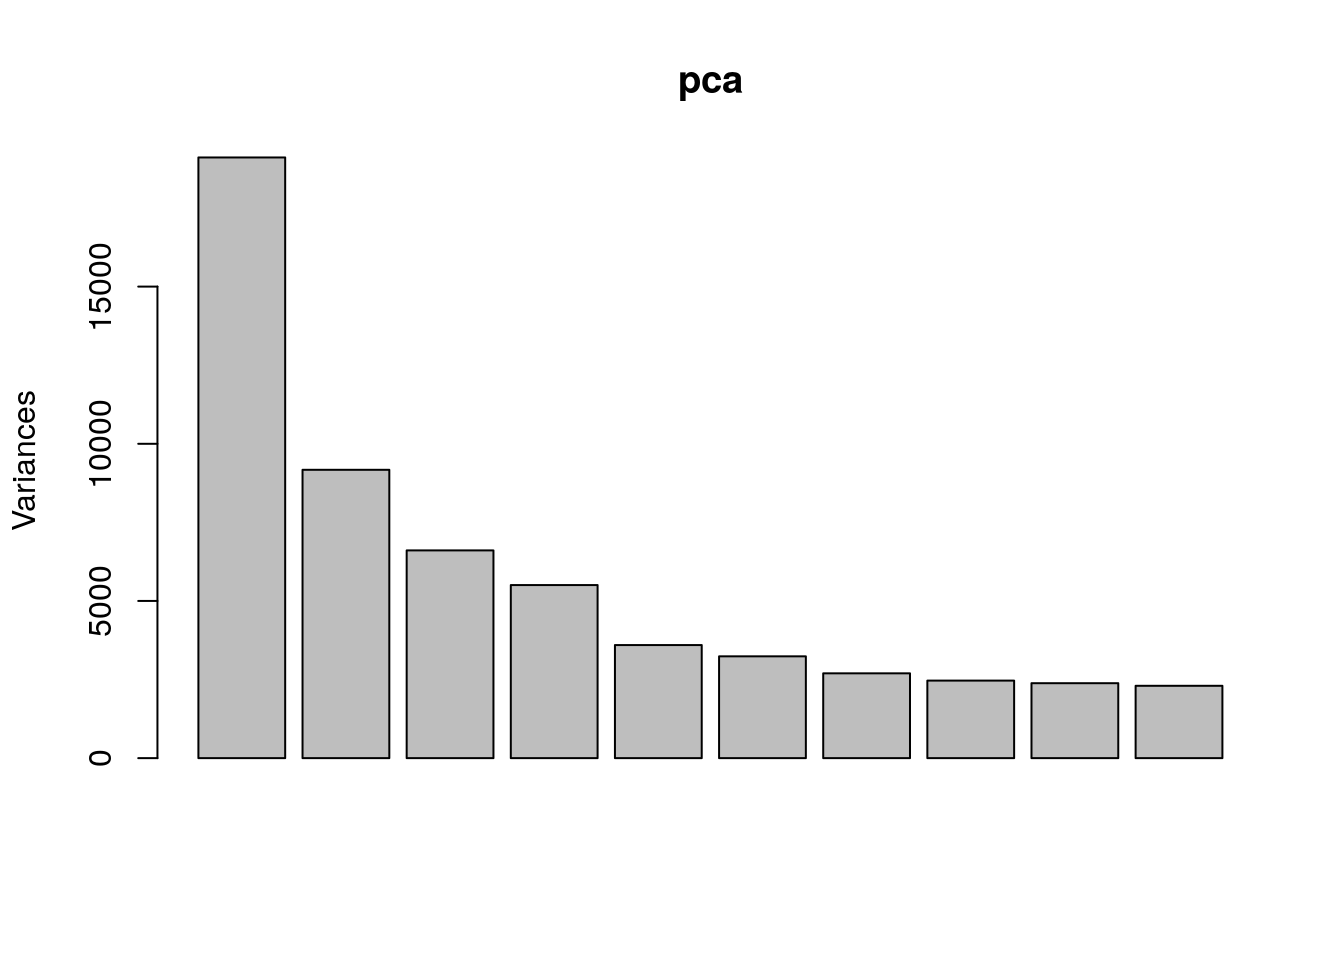
d <- data.frame(pData(eset), pca$x)
ggplot(d, aes(x = PC1, y = PC2, color = genotype, shape = treatment)) +
  geom_point()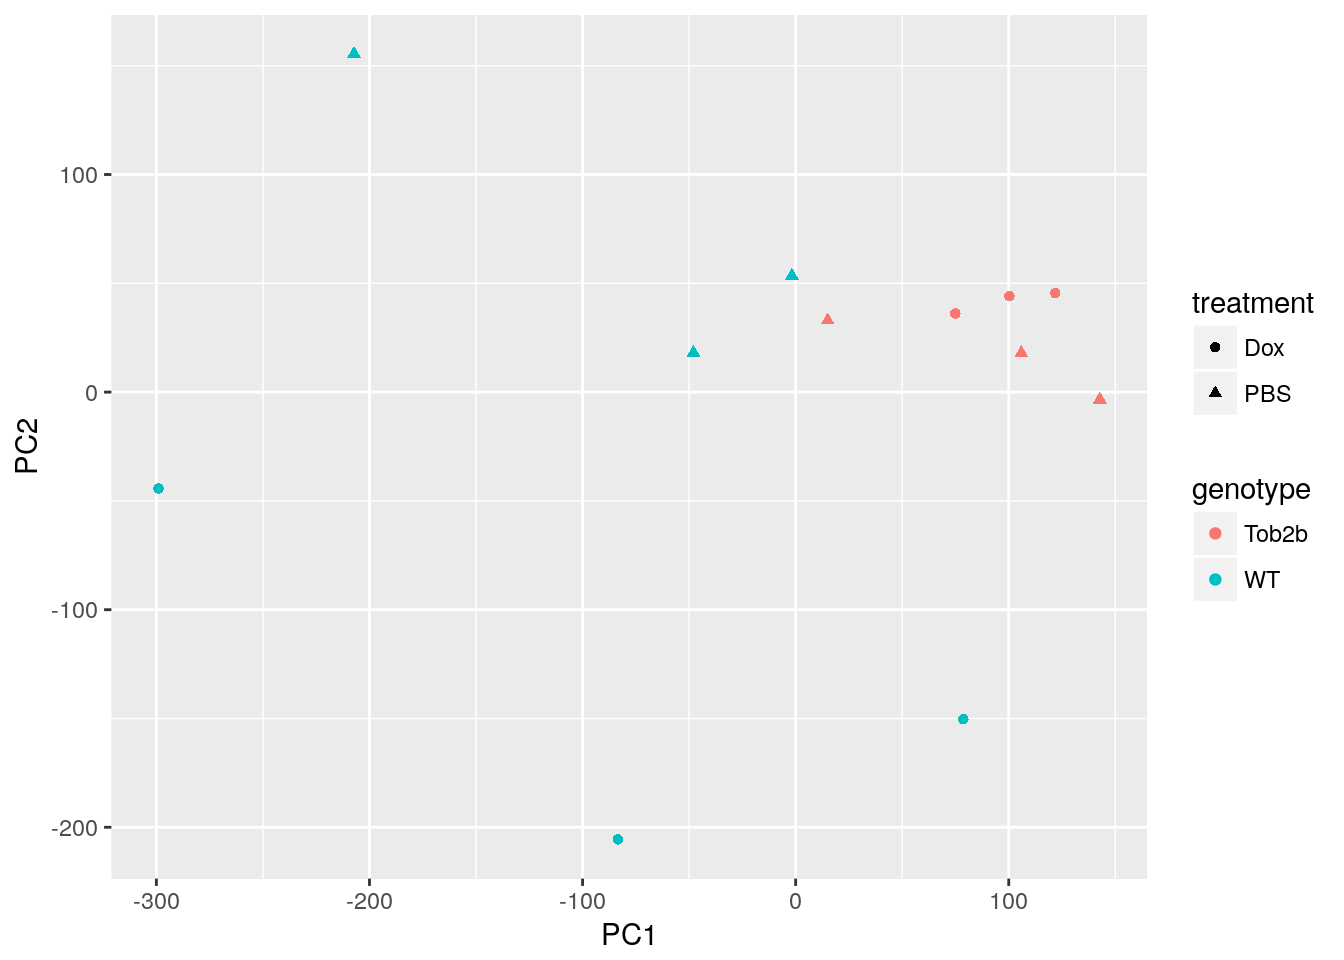
ggplot(d, aes(x = treatment, y = PC1, fill = genotype)) +
  geom_boxplot()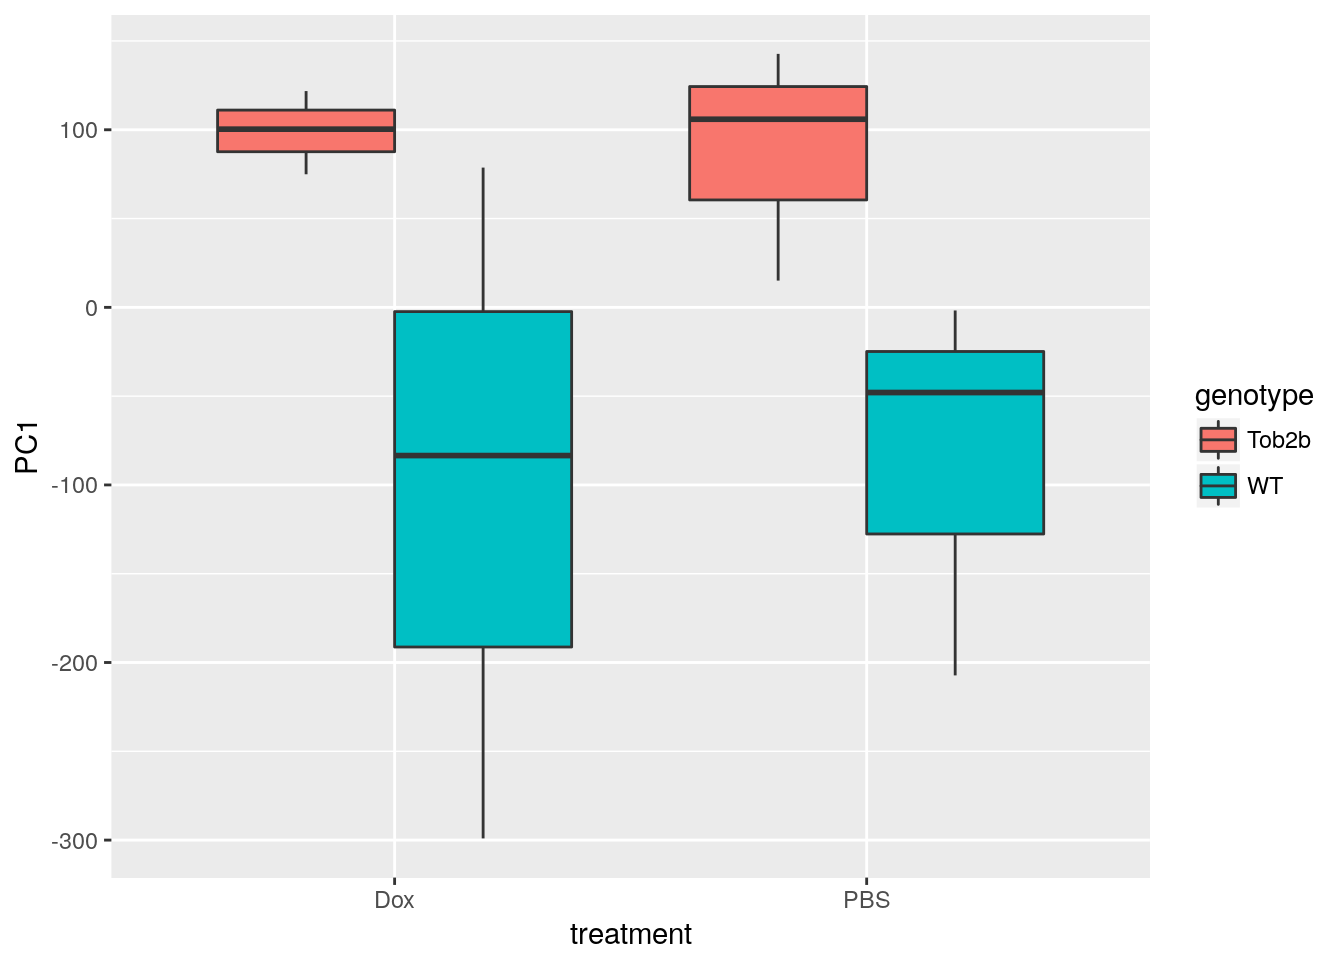
ggplot(d, aes(x = treatment, y = PC2, fill = genotype)) +
  geom_boxplot()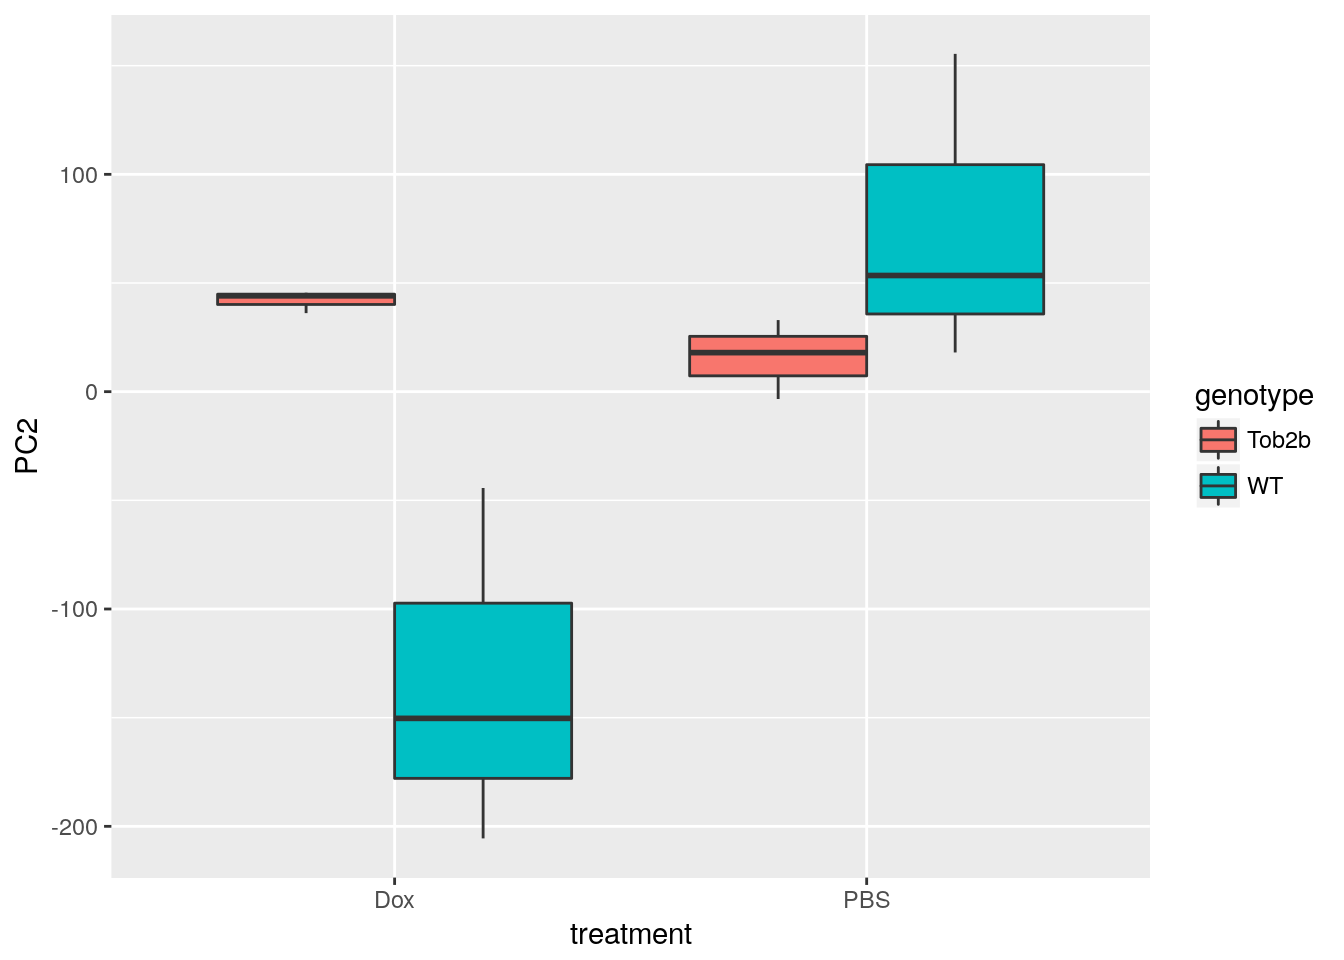
Differential expression for 2x2 factorial designs (Video)
Discuss how to construct a design and contrasts matrix for a 2x2 factorial design. Note how to create a combined factor and how to write the contrast for the interaction term.
Create design matrix for 2x2 factorial design
Create a combined factor using paste. Use model.matrix to create a linear model with 4 binary variables (group-means parametrization).
f <- paste(pData(eset)$genotype, pData(eset)$treatment, sep = ".")
design <- model.matrix(~0 + f)
colnames(design) <- sub("f", "", colnames(design))
colSums(design)
Tob2b.Dox Tob2b.PBS WT.Dox WT.PBS
3 3 3 3 Create contrasts matrix for 2x2 factorial design
Use limma::makeContrasts to test the main effects and the interaction between genotype and treatment.
cont_mat <- makeContrasts(DoxWT = WT.Dox - WT.PBS,
                          DoxTop = Tob2b.Dox - Tob2b.PBS,
                          Interaction = (Tob2b.Dox - Tob2b.PBS) -
                                        (WT.Dox - WT.PBS),
                          levels = design)
Fit and test 2x2 factorial design
Use limma::lmFit, limma::contrasts.fit, limma::eBayes, and limma::decideTests to fit and test the model. Use limma::vennDiagram to visualize overlap of differentially expressed genes.
fit <- lmFit(eset, design)
head(fit$coefficients)
Tob2b.Dox Tob2b.PBS WT.Dox WT.PBS
1 0.2975107 0.2945810 0.3539563 0.3620450
2 4.2250150 4.6055087 3.6762460 3.1691957
3 0.3001070 0.3196167 0.6157077 0.3739970
4 0.3012637 0.2955227 0.3532647 0.3616193
5 264.7589623 245.4630817 294.2404533 274.2917363
6 0.3032463 0.2958423 0.3525713 0.3611247fit2 <- contrasts.fit(fit, contrasts = cont_mat)
fit2 <- eBayes(fit2)
results <- decideTests(fit2)
summary(results) DoxWT DoxTop Interaction
-1 2311 0 320
0 55050 59304 58071
1 1944 1 914vennDiagram(results)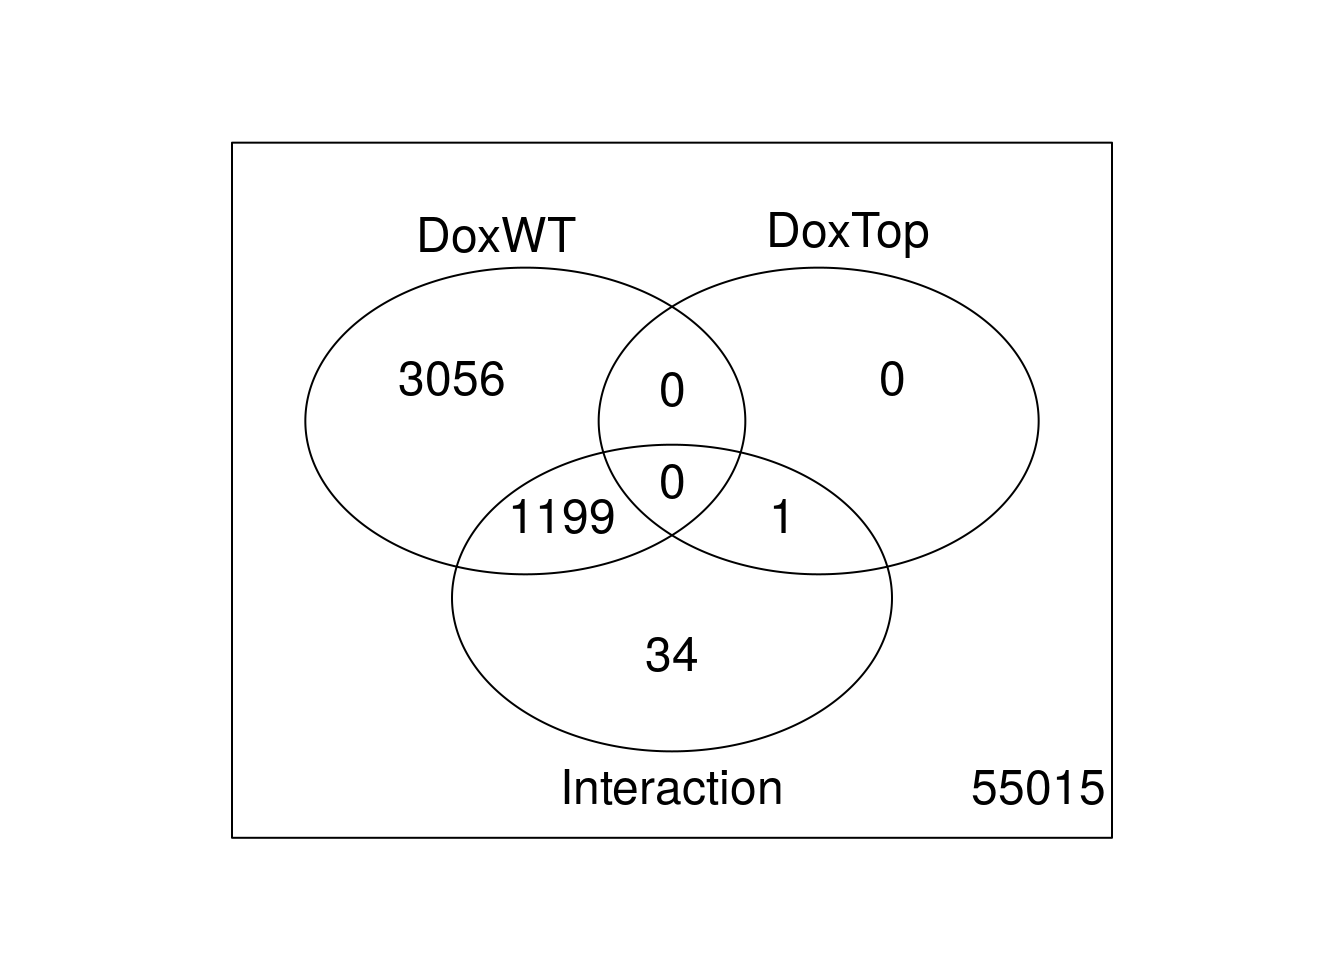
Enrichment analysis (Video)
Describe common approaches for testing for enrichment of gene sets. Discuss Gene Onotlogy categories and KEGG pathways. Introduce Fisher’s Exact Test. Stress the importance of choosing the correct background set of genes and caution against over-interpretation (especially for directional effect). Mention at the end that there are more sophisticated algorithms such as limma::camera, limma::roast, and goseq::goseq.
Enrichment of KEGG pathways
Use limma::kegga and limma::topKEGG to test for enrichment of differentially expressed genes in KEGG pathways.
entrez <- fit2$genes$entrez
enrich_kegg_wt <- kegga(fit2, coef = "DoxWT",
                        geneid = entrez, species = "Mm")
topKEGG(enrich_kegg_wt)
Pathway N
path:mmu05322 Systemic lupus erythematosus 110
path:mmu05034 Alcoholism 165
path:mmu03008 Ribosome biogenesis in eukaryotes 77
path:mmu05203 Viral carcinogenesis 212
path:mmu05412 Arrhythmogenic right ventricular cardiomyopathy (ARVC) 72
path:mmu04137 Mitophagy - animal 63
path:mmu04261 Adrenergic signaling in cardiomyocytes 145
path:mmu04022 cGMP-PKG signaling pathway 166
path:mmu05414 Dilated cardiomyopathy (DCM) 88
path:mmu04012 ErbB signaling pathway 85
path:mmu04217 Necroptosis 158
path:mmu04971 Gastric acid secretion 74
path:mmu05410 Hypertrophic cardiomyopathy (HCM) 83
path:mmu04144 Endocytosis 262
path:mmu05202 Transcriptional misregulation in cancer 174
path:mmu05205 Proteoglycans in cancer 201
path:mmu03040 Spliceosome 129
path:mmu04066 HIF-1 signaling pathway 103
path:mmu03013 RNA transport 166
path:mmu04115 p53 signaling pathway 67
Up Down P.Up P.Down
path:mmu05322 25 1 1.426245e-10 9.997085e-01
path:mmu05034 29 12 3.105091e-09 5.059241e-01
path:mmu03008 19 2 5.656212e-09 9.764694e-01
path:mmu05203 33 11 6.099541e-09 8.943148e-01
path:mmu05412 0 20 1.000000e+00 6.876649e-08
path:mmu04137 15 7 3.885675e-07 1.560142e-01
path:mmu04261 5 27 8.673626e-01 2.721260e-06
path:mmu04022 4 29 9.727255e-01 4.439987e-06
path:mmu05414 0 19 1.000000e+00 9.219800e-06
path:mmu04012 5 18 4.354549e-01 2.095579e-05
path:mmu04217 21 14 4.560626e-05 2.283053e-01
path:mmu04971 2 16 8.966206e-01 4.580638e-05
path:mmu05410 0 17 1.000000e+00 5.557234e-05
path:mmu04144 29 20 5.812766e-05 3.967395e-01
path:mmu05202 22 10 6.526743e-05 7.975774e-01
path:mmu05205 13 30 2.223823e-01 7.169396e-05
path:mmu03040 18 11 8.390967e-05 3.054608e-01
path:mmu04066 8 19 1.524219e-01 9.334771e-05
path:mmu03013 21 8 9.472685e-05 9.099991e-01
path:mmu04115 12 2 1.185986e-04 9.561380e-01enrich_kegg_inter <- kegga(fit2, coef = "Interaction",
geneid = entrez, species = "Mm")
topKEGG(enrich_kegg_inter) Pathway N
path:mmu03008 Ribosome biogenesis in eukaryotes 77
path:mmu05322 Systemic lupus erythematosus 110
path:mmu05034 Alcoholism 165
path:mmu05203 Viral carcinogenesis 212
path:mmu04919 Thyroid hormone signaling pathway 115
path:mmu00230 Purine metabolism 174
path:mmu05414 Dilated cardiomyopathy (DCM) 88
path:mmu05412 Arrhythmogenic right ventricular cardiomyopathy (ARVC) 72
path:mmu05212 Pancreatic cancer 75
path:mmu05220 Chronic myeloid leukemia 78
path:mmu05205 Proteoglycans in cancer 201
path:mmu04930 Type II diabetes mellitus 48
path:mmu04261 Adrenergic signaling in cardiomyocytes 145
path:mmu04211 Longevity regulating pathway 90
path:mmu05222 Small cell lung cancer 92
path:mmu04210 Apoptosis 134
path:mmu05213 Endometrial cancer 58
path:mmu04933 AGE-RAGE signaling pathway in diabetic complications 100
path:mmu05217 Basal cell carcinoma 63
path:mmu01522 Endocrine resistance 93
Up Down P.Up P.Down
path:mmu03008 0 10 1.0000000000 1.112720e-08
path:mmu05322 0 10 1.0000000000 3.521623e-07
path:mmu05034 5 11 0.5255044610 2.016981e-06
path:mmu05203 3 12 0.9492156881 3.743765e-06
path:mmu04919 11 2 0.0004835667 3.712397e-01
path:mmu00230 14 3 0.0005136952 3.103476e-01
path:mmu05414 9 0 0.0009716250 1.000000e+00
path:mmu05412 8 0 0.0010756656 1.000000e+00
path:mmu05212 3 5 0.3720331617 1.478029e-03
path:mmu05220 4 5 0.1904216149 1.760999e-03
path:mmu05205 14 5 0.0020872023 7.498761e-02
path:mmu04930 6 1 0.0024778049 4.192730e-01
path:mmu04261 11 1 0.0032165847 8.083757e-01
path:mmu04211 3 5 0.4878447796 3.300887e-03
path:mmu05222 1 5 0.9345473342 3.629591e-03
path:mmu04210 6 6 0.1938597213 3.834680e-03
path:mmu05213 3 4 0.2368628122 3.961212e-03
path:mmu04933 6 5 0.0702488039 5.182159e-03
path:mmu05217 4 4 0.1097270801 5.330731e-03
path:mmu01522 8 3 0.0054454308 8.638351e-02Enrichment of Gene Ontology categories
Use limma::goana and limma::topGO to test for enrichment of differentially expressed genes in Gene Ontology categories.
enrich_go_wt <- goana(fit2, coef = "DoxWT",
                      geneid = entrez, species = "Mm")
topGO(enrich_go_wt, ontology = "BP")
Term Ont N Up
GO:0090304 nucleic acid metabolic process BP 4320 411
GO:0044260 cellular macromolecule metabolic process BP 7119 574
GO:0016070 RNA metabolic process BP 3866 371
GO:0006139 nucleobase-containing compound metabolic process BP 4868 428
GO:0034641 cellular nitrogen compound metabolic process BP 5483 461
GO:0046483 heterocycle metabolic process BP 4987 430
GO:0006725 cellular aromatic compound metabolic process BP 5044 432
GO:0043170 macromolecule metabolic process BP 7787 594
GO:0010467 gene expression BP 4584 401
GO:0006807 nitrogen compound metabolic process BP 5772 474
GO:1901360 organic cyclic compound metabolic process BP 5218 434
GO:0006396 RNA processing BP 752 112
GO:0044237 cellular metabolic process BP 8868 640
GO:0022613 ribonucleoprotein complex biogenesis BP 365 71
GO:0044238 primary metabolic process BP 8881 631
GO:0044763 single-organism cellular process BP 9405 524
GO:0034645 cellular macromolecule biosynthetic process BP 4071 342
GO:0009059 macromolecule biosynthetic process BP 4189 347
GO:0071704 organic substance metabolic process BP 9265 644
GO:0032774 RNA biosynthetic process BP 3128 278
Down P.Up P.Down
GO:0090304 331 8.237144e-36 1.933475e-02
GO:0044260 582 2.562324e-32 2.605503e-07
GO:0016070 306 2.634152e-32 4.728531e-03
GO:0006139 395 1.986706e-29 1.458069e-04
GO:0034641 452 1.080822e-27 6.550268e-06
GO:0046483 409 1.139985e-27 3.881083e-05
GO:0006725 412 3.540449e-27 5.247892e-05
GO:0043170 625 1.076190e-26 1.009762e-06
GO:0010467 369 1.336454e-26 4.980610e-04
GO:0006807 469 2.851898e-26 1.935534e-05
GO:1901360 424 1.605578e-24 6.287642e-05
GO:0006396 66 8.890930e-23 2.842314e-02
GO:0044237 740 1.082989e-22 2.998919e-12
GO:0022613 25 2.882609e-21 5.557635e-01
GO:0044238 728 3.338037e-20 3.451549e-10
GO:0044763 814 2.248867e-01 3.148649e-19
GO:0034645 332 6.059148e-19 4.291718e-04
GO:0009059 339 2.848717e-18 6.358933e-04
GO:0071704 764 2.961528e-18 1.291450e-11
GO:0032774 243 3.168260e-18 2.640811e-02enrich_go_inter <- goana(fit2, coef = "Interaction",
geneid = entrez, species = "Mm")
topGO(enrich_go_inter, ontology = "BP") Term Ont N Up Down
GO:0034470 ncRNA processing BP 298 10 20
GO:0006334 nucleosome assembly BP 86 1 12
GO:0034728 nucleosome organization BP 111 2 13
GO:0006396 RNA processing BP 752 29 30
GO:0034660 ncRNA metabolic process BP 406 13 22
GO:0071103 DNA conformation change BP 175 3 15
GO:0042254 ribosome biogenesis BP 245 4 17
GO:0031497 chromatin assembly BP 105 1 12
GO:0060047 heart contraction BP 197 25 2
GO:0003015 heart process BP 200 25 2
GO:0006996 organelle organization BP 3306 157 58
GO:0016072 rRNA metabolic process BP 201 4 15
GO:0006364 rRNA processing BP 173 3 14
GO:0008016 regulation of heart contraction BP 163 22 2
GO:0044763 single-organism cellular process BP 9405 356 101
GO:0061337 cardiac conduction BP 54 13 0
GO:0086003 cardiac muscle cell contraction BP 55 13 0
GO:0006333 chromatin assembly or disassembly BP 127 2 12
GO:0022613 ribonucleoprotein complex biogenesis BP 365 12 19
GO:0090304 nucleic acid metabolic process BP 4320 145 80
P.Up P.Down
GO:0034470 4.186529e-01 4.221255e-11
GO:0006334 9.298010e-01 8.594260e-11
GO:0034728 8.545642e-01 1.325168e-10
GO:0006396 1.119846e-01 2.382955e-10
GO:0034660 4.618739e-01 2.687212e-10
GO:0071103 9.037569e-01 4.308571e-10
GO:0042254 9.421080e-01 7.750073e-10
GO:0031497 9.610251e-01 9.237360e-10
GO:0060047 1.602977e-09 6.069567e-01
GO:0003015 2.201973e-09 6.151907e-01
GO:0006996 2.278770e-09 2.205572e-05
GO:0016072 8.628904e-01 2.950107e-09
GO:0006364 8.995292e-01 3.543597e-09
GO:0008016 4.825936e-09 5.044555e-01
GO:0044763 5.589447e-09 3.282408e-01
GO:0061337 5.788772e-09 1.000000e+00
GO:0086003 7.372161e-09 1.000000e+00
GO:0006333 9.014547e-01 8.340962e-09
GO:0022613 4.303453e-01 9.070431e-09
GO:0090304 9.200455e-02 1.882863e-08Session information
sessionInfo()R version 3.4.3 (2017-11-30)
Platform: x86_64-pc-linux-gnu (64-bit)
Running under: Ubuntu 17.10
Matrix products: default
BLAS: /usr/lib/x86_64-linux-gnu/blas/libblas.so.3.7.1
LAPACK: /usr/lib/x86_64-linux-gnu/lapack/liblapack.so.3.7.1
locale:
[1] LC_CTYPE=en_US.UTF-8 LC_NUMERIC=C
[3] LC_TIME=en_US.UTF-8 LC_COLLATE=en_US.UTF-8
[5] LC_MONETARY=en_US.UTF-8 LC_MESSAGES=en_US.UTF-8
[7] LC_PAPER=en_US.UTF-8 LC_NAME=C
[9] LC_ADDRESS=C LC_TELEPHONE=C
[11] LC_MEASUREMENT=en_US.UTF-8 LC_IDENTIFICATION=C
attached base packages:
[1] parallel stats graphics grDevices utils datasets methods
[8] base
other attached packages:
[1] limma_3.32.2 ggplot2_2.2.1 Biobase_2.36.2
[4] BiocGenerics_0.22.1
loaded via a namespace (and not attached):
[1] Rcpp_0.12.14 AnnotationDbi_1.38.0 knitr_1.18
[4] magrittr_1.5 IRanges_2.10.0 munsell_0.4.3
[7] colorspace_1.3-2 rlang_0.1.6.9003 stringr_1.2.0
[10] plyr_1.8.4 tools_3.4.3 grid_3.4.3
[13] gtable_0.2.0 DBI_0.7 git2r_0.21.0
[16] htmltools_0.3.6 yaml_2.1.16 lazyeval_0.2.1
[19] rprojroot_1.3-2 digest_0.6.14 tibble_1.4.2
[22] org.Mm.eg.db_3.4.1 S4Vectors_0.14.0 memoise_1.1.0
[25] RSQLite_1.1-2 evaluate_0.10.1 rmarkdown_1.8
[28] labeling_0.3 stringi_1.1.6 GO.db_3.4.1
[31] compiler_3.4.3 pillar_1.1.0 scales_0.5.0
[34] backports_1.1.2 stats4_3.4.3 This R Markdown site was created with workflowr