How Apex orchestrates the DAG lifecycle
Apache Apex (incubating) uses the concept of a DAG to represent an application’s processing logic. This blog will introduce the different perspectives within the architecture, starting from specification by the user to execution within the engine.
Understanding DAGs
DAG, or Directed Acyclic Graph, expresses processing logic as operators (vertices) and streams (edges) that together make an Apache ® Apex (incubating) application. Just as the name suggests, the resulting graph must be acyclic, while specifying the logic that will be executed in sequence or in parallel. DAGs are used to exhibit dependencies, such as in event-based systems where previously occurred events lead to newer ones. The DAG concept is widely used, for example in revision control systems such as Git. Apex leverages the concept of a DAG to express how data is processed. Operators function as nodes within the graph, which are connected by a stream of events called tuples.
There are several frameworks in the wider Hadoop ecosystem that employ the DAG concept to model dependencies. Some of those trace back to MapReduce, where the processing logic is a two operator sequence: map and reduce. This is simple but also rigid, as most processing pipelines have a more complex structure. Therefore, when using MapReduce directly, multiple map-reduce stages need to be chained together to achieve the overall goal. Coordination is not trivial, which lead to the rise of higher level frameworks that attempt to shield the user from this complexity, such as Pig, Hive, Cascading, etc. Earlier on, Pig and Hive directly translated into a MapReduce execution layer, later Tez came into the picture as alternative, common layer for optimization and execution. Other platforms such as Storm and Spark also represent the logic as DAG, each with its own flavor of specification and different architecture of execution layer.
DAG of operators represents the business logic
Apex permits any operation to be applied to a stream of events and there is practically no limitation on the complexity of the ensuing DAG of operators. The full DAG blueprint is visible to the engine, which means that it can be translated into an end-to-end, fault-tolerant, scalable execution layer.
The operators represent the point where business logic is introduced. Operators receive events via input ports, and emit events via output ports to represent the execution of a user-defined functionality. Operators that don’t receive events on a port are called the input operators. They receive events from external systems, thus acting as roots of the DAG.
Operators can implement any functionality. It can be code that is very specific to a use case or generic and broadly applicable functionality like the operators that are part of the Apex Malhar operator library, with support for reading from various sources, transformations, filtering, dimensional computation or write to a variety of destinations.
Specifying a DAG
As discussed earlier, a DAG is comprised of connections between output ports and input ports. Operators can have multiple input and output ports, each of a different type. This simplifies the operator programming because the port concept clearly highlights the source and type of the event. This information is visible to the Java compiler, thus enabling immediate feedback to the developer working in the IDE.
Similar to the DOM in a web browser, which can result from a static HTML source or a piece of JavaScript that created it on the fly, an Apex DAG can be created from different source representations, and dynamically modified after the application is running!
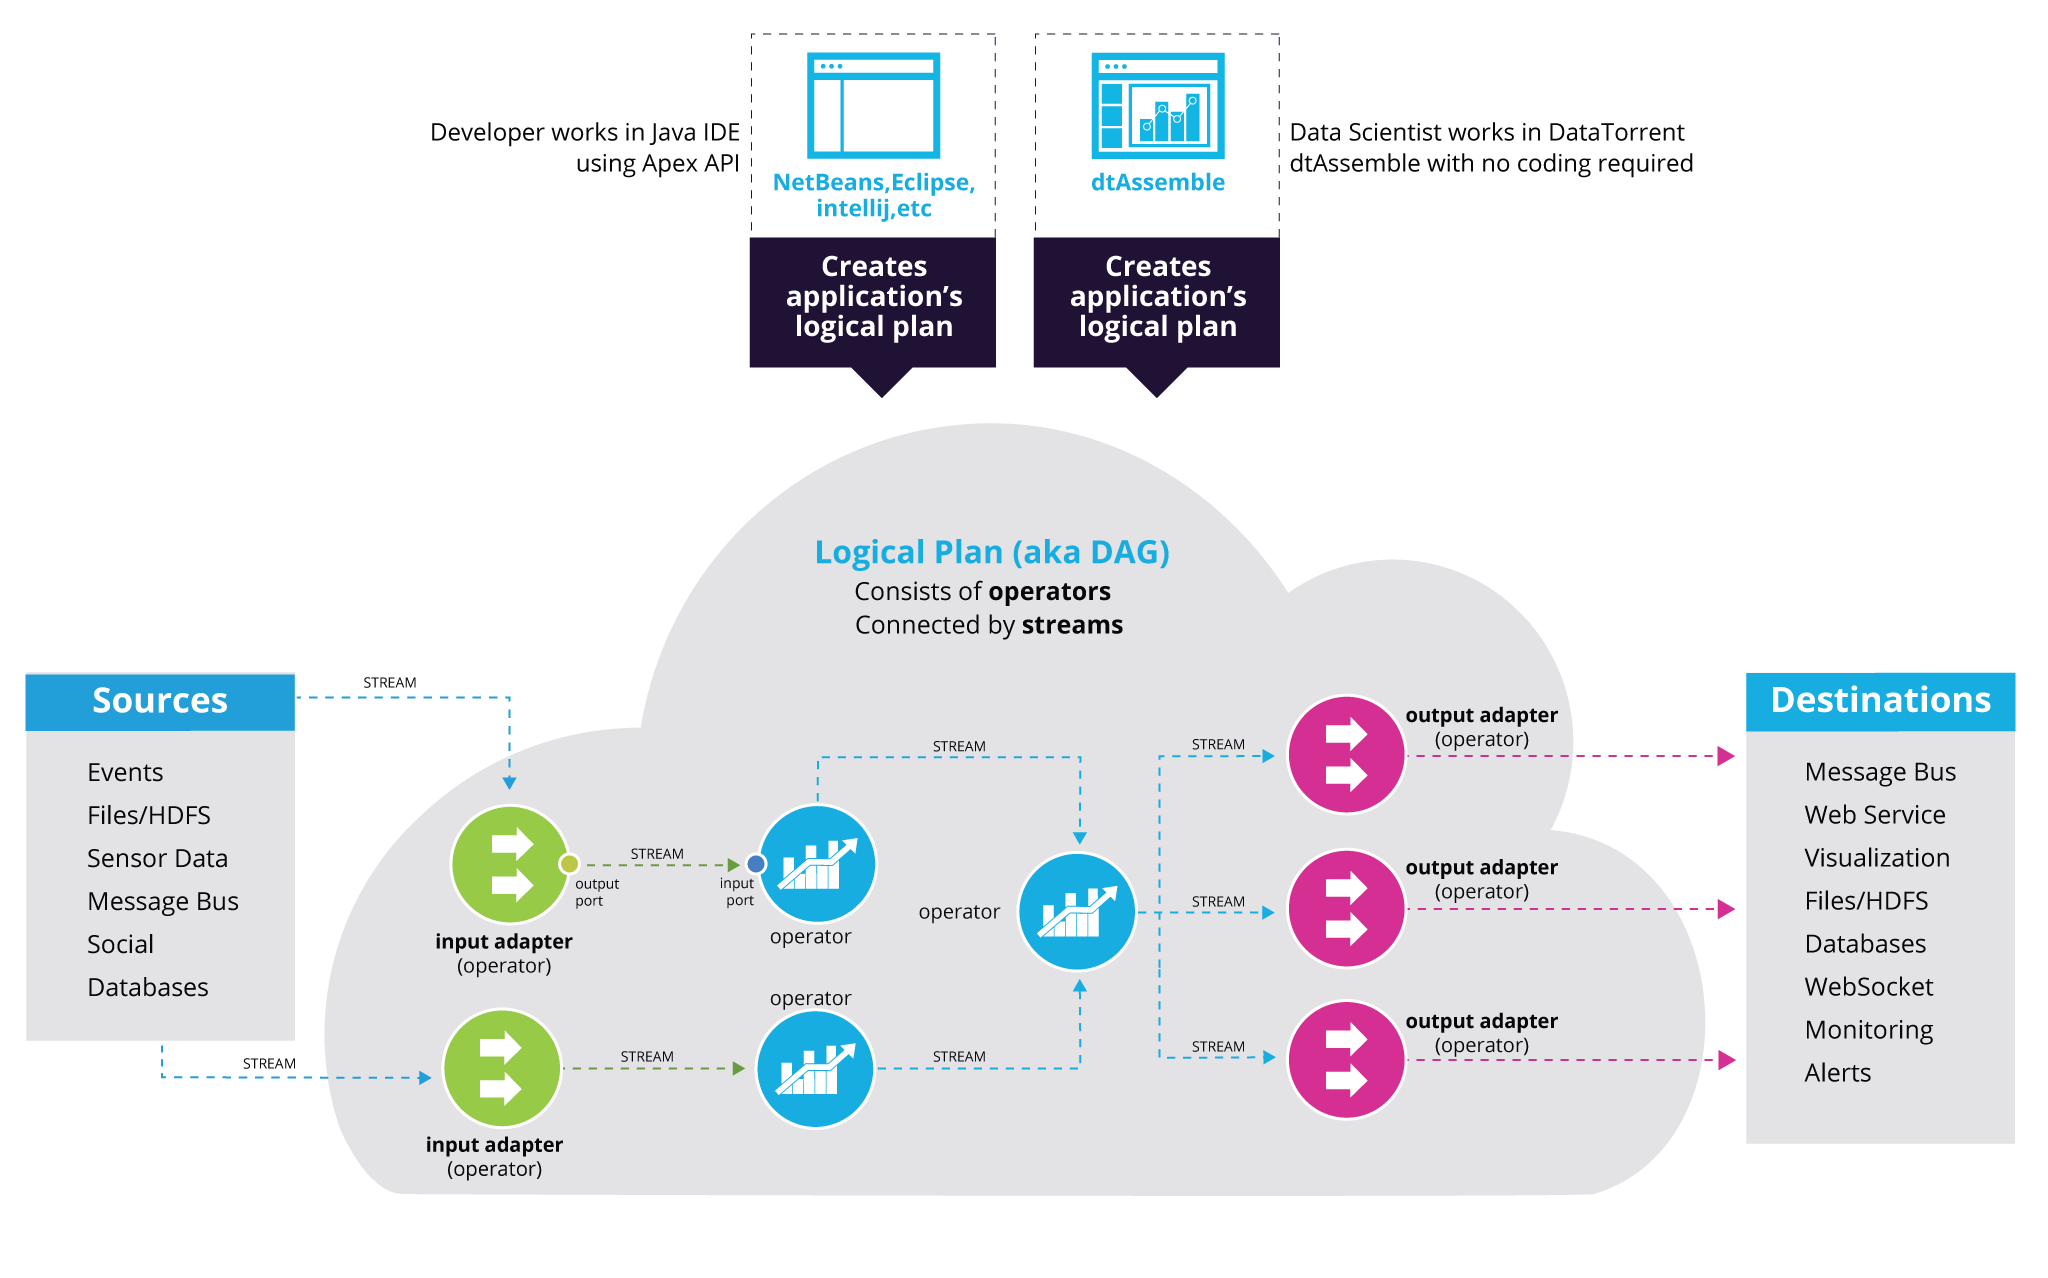
We refer to the DAG that was specified by the user as the “logical plan”. This is because upon launch it will be translated into a physical plan, and then mapped to an execution layer (more on this process below).
A simple example
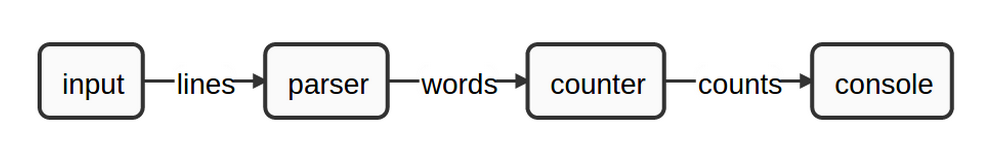
Let’s consider the example of the WordCount application, which is the de-facto hello world application of Hadoop. Here is how this simple, sequential DAG will look: The input operator reads a file to emit lines. The “lines” act as a stream, which in turn becomes the input for the parser operator. The parser operator performs a parse operation to generate words for the counter operator. The counter operator emits tuples (word, count) to the console.
The source for the logical plan can be in different formats. Using the Apex Java API, the WordCount example could look like this:
@ApplicationAnnotation(name="MyFirstApplication")
public class Application implements StreamingApplication
{
  @Override
  public void populateDAG(DAG dag, Configuration conf)
  {
    LineReader lineReader = dag.addOperator("input", new LineReader());
    Parser parser = dag.addOperator("parser", new Parser());
    UniqueCounter counter = dag.addOperator("counter", new UniqueCounter());
    ConsoleOutputOperator cons = dag.addOperator("console", new ConsoleOutputOperator());
    dag.addStream("lines", lineReader.output, parser.input);
    dag.addStream("words", parser.output, counter.data);
    dag.addStream("counts", counter.count, cons.input);
  }
}
The same WordCount application can be specified through JSON format (typically generated by a tool, such as the DataTorrent RTS application builder known as dtAssemble):
{
"displayName": "WordCountJSON",
"operators": [
{
"name": "input",
...
},
{
"name": "parse",
...
},
{
"name": "count",
"class": "com.datatorrent.lib.algo.UniqueCounter",
"properties": {
"com.datatorrent.lib.algo.UniqueCounter": {
"cumulative": false
}
}
},
{
"name": "console",
...
}
],
"streams": [
{
"name": "lines",
"sinks": [
{
"operatorName": "parse",
"portName": "input"
}
],
"source": {
"operatorName": "input",
"portName": "output"
}
},
{
"name": "words",
...
},
{
"name": "counts",
...
}
]
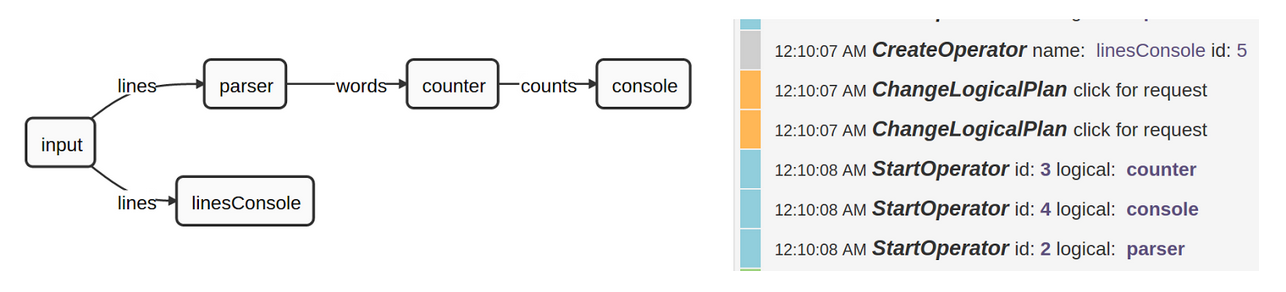
}As mentioned previously, the DAG can also be modified after an application was launched. In the following example we add another console operator to display the lines emitted by the input operator:
Connected to application application_1442901180806_0001
dt (application_1442901180806_0001) > begin-logical-plan-change
logical-plan-change (application_1442901180806_0001) > create-operator linesConsole com.datatorrent.lib.io.ConsoleOutputOperator
logical-plan-change (application_1442901180806_0001) > add-stream-sink lines linesConsole input
logical-plan-change (application_1442901180806_0001) > submit
{}
Translation of logical DAG into physical plan
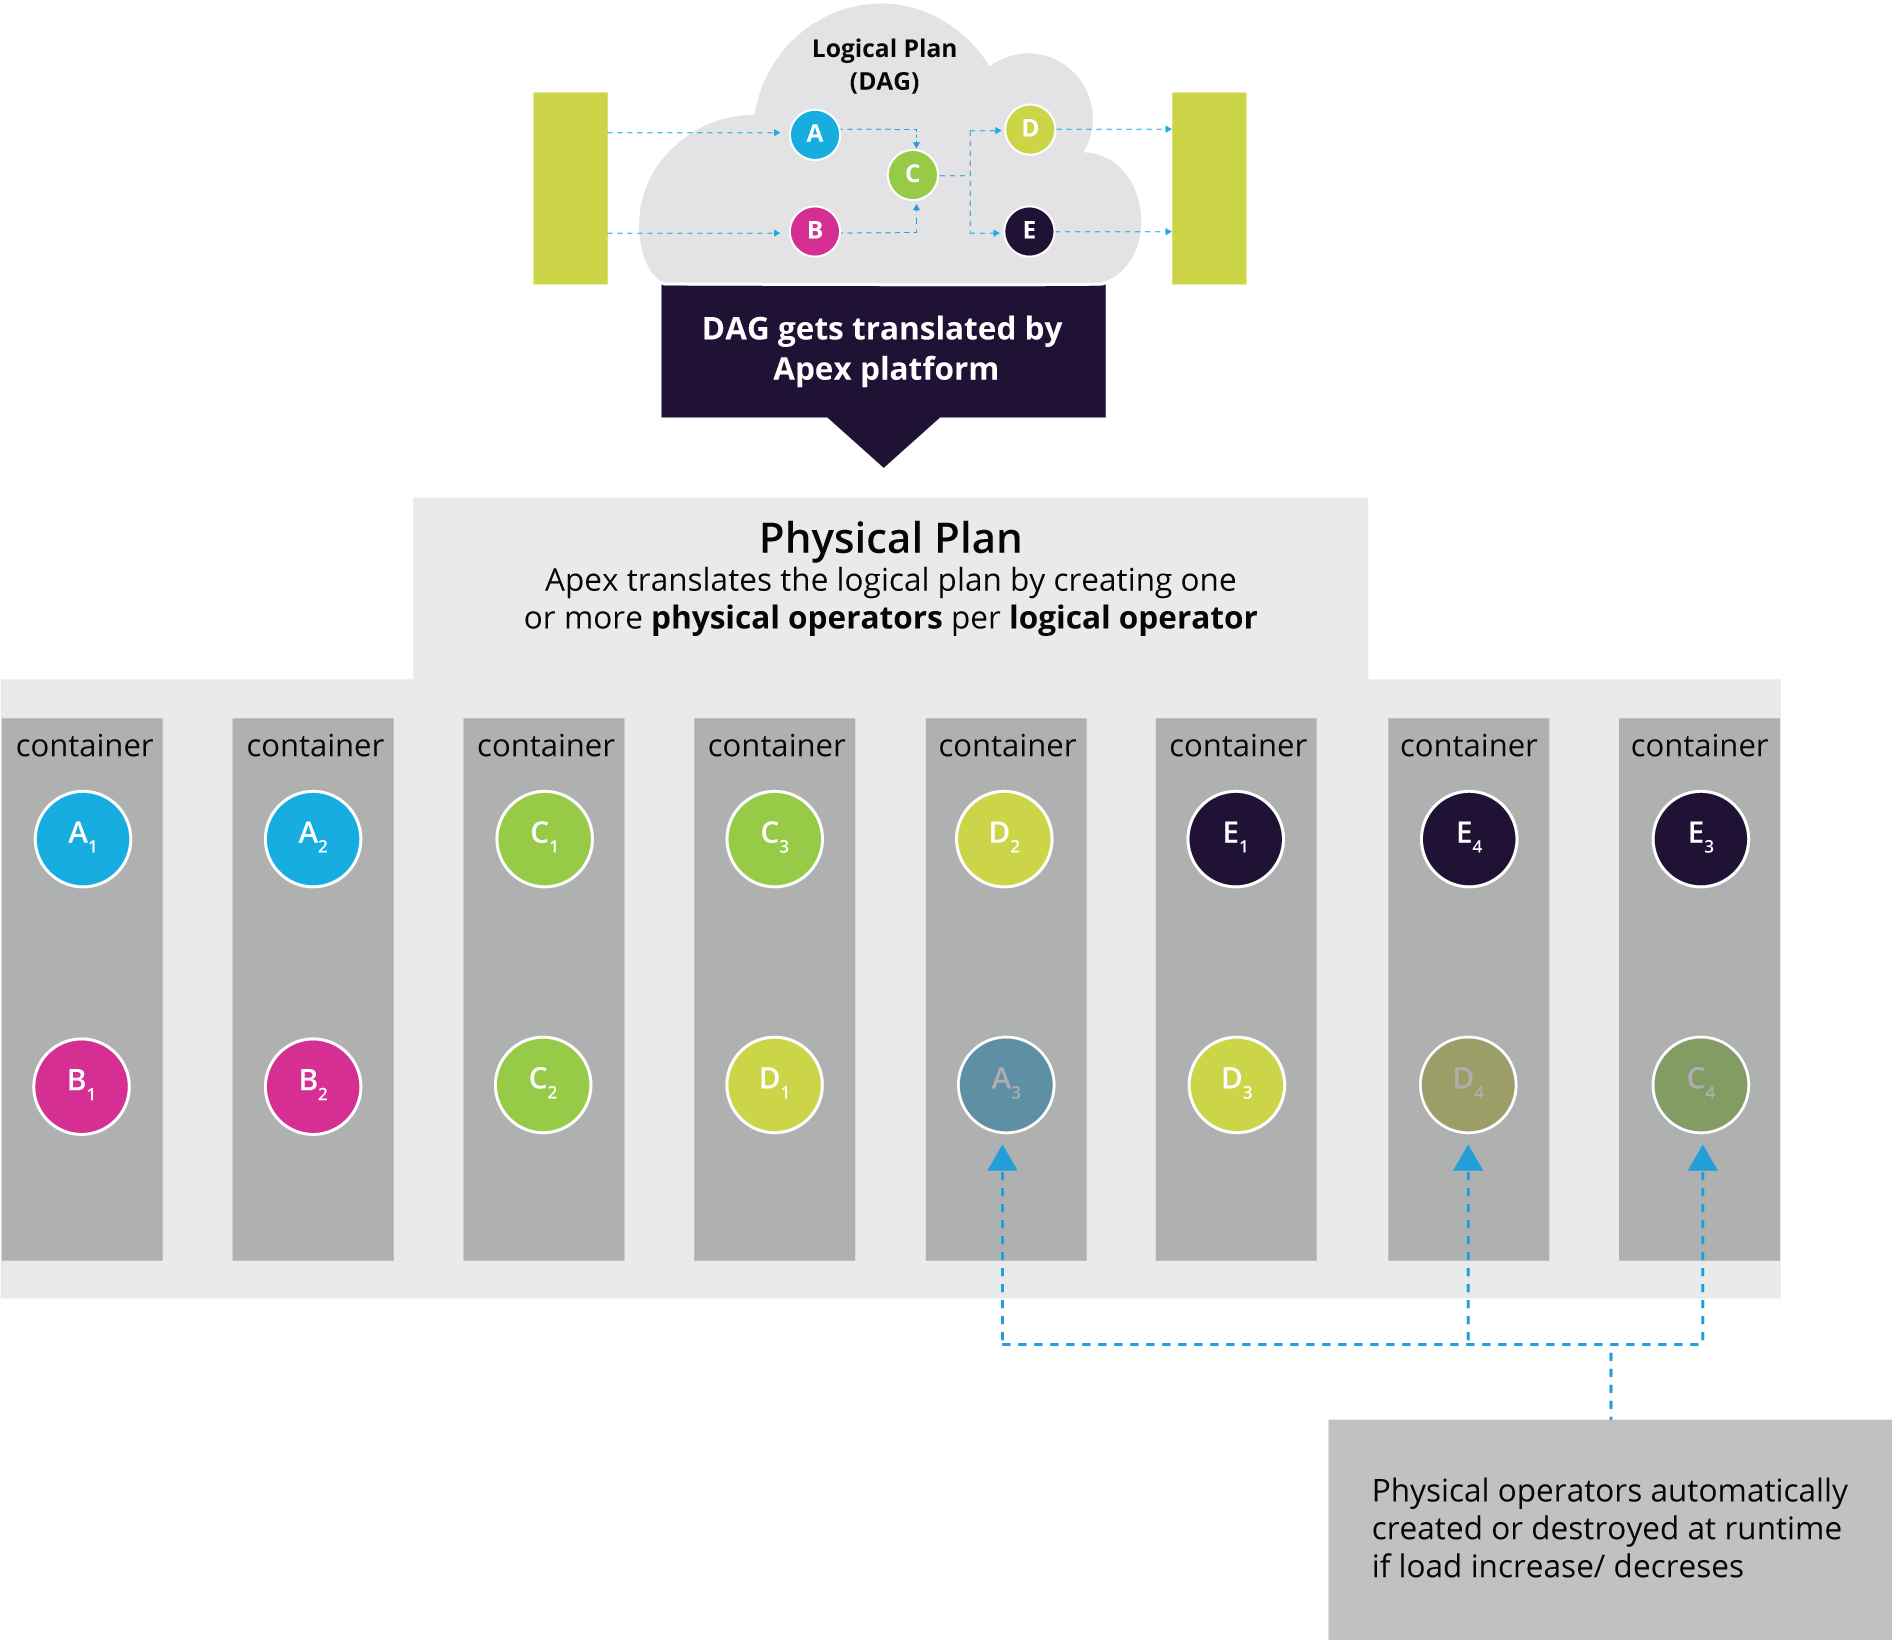
Users specify the logical DAG. This logical representation is provided to the Apex client that bootstraps an application. When running on a YARN cluster, this client will launch the StrAM (Streaming Application Master), along with the logical plan and exit. StrAM takes over and, as a first task, converts the logical DAG into a physical plan.
To do so, StrAM assigns the operators within the DAG to containers, which will later correspond to actual YARN containers in the execution layer. You can influence many aspects of this translation using (optional) attributes in the the logical plan. The physical plan layout determines the performance and scalability of the application, which is why the configuration will typically specify more attributes as the application evolves.
Here are a few examples of attributes:
- The amount of memory that an operator requires
- The operator partitioning
- Affinity between operators (aka stream locality)
- Windows (sliding, tumbling)
- Checkpointing
- JVM options for a container process
- Timeout and interval settings for monitoring
- Queue sizes
The physical plan works as the blueprint for the execution layer
The physical plan lays the foundation for the execution layer, but because both are distinct, the same physical plan can be mapped to different execution layers.
Apex was designed to run on YARN natively and take full advantage of its features. When executing on YARN, resource scheduling and allocation are the responsibility of the underlying infrastructure.
There is only one other execution layer implementation for development purposes: Local mode will host an entire application within a single JVM. This allows to do all work including functional testing and efficient debugging within an IDE, before packaging the application and taking it to the YARN cluster.
Executing the physical plan on YARN
When running on YARN, each container in the physical plan is mapped to a separate process (called a container). The containers are requested by StrAM based on the resource specification prescribed by the physical plan. Once the resource manager allocates a container, StrAM will launch the processes on the respective node manager. We call these processes Streaming Containers, reflecting their facilitation for the data flow. The container, once launched, initiates the heartbeat protocol for passing on status information about the execution to StrAM.
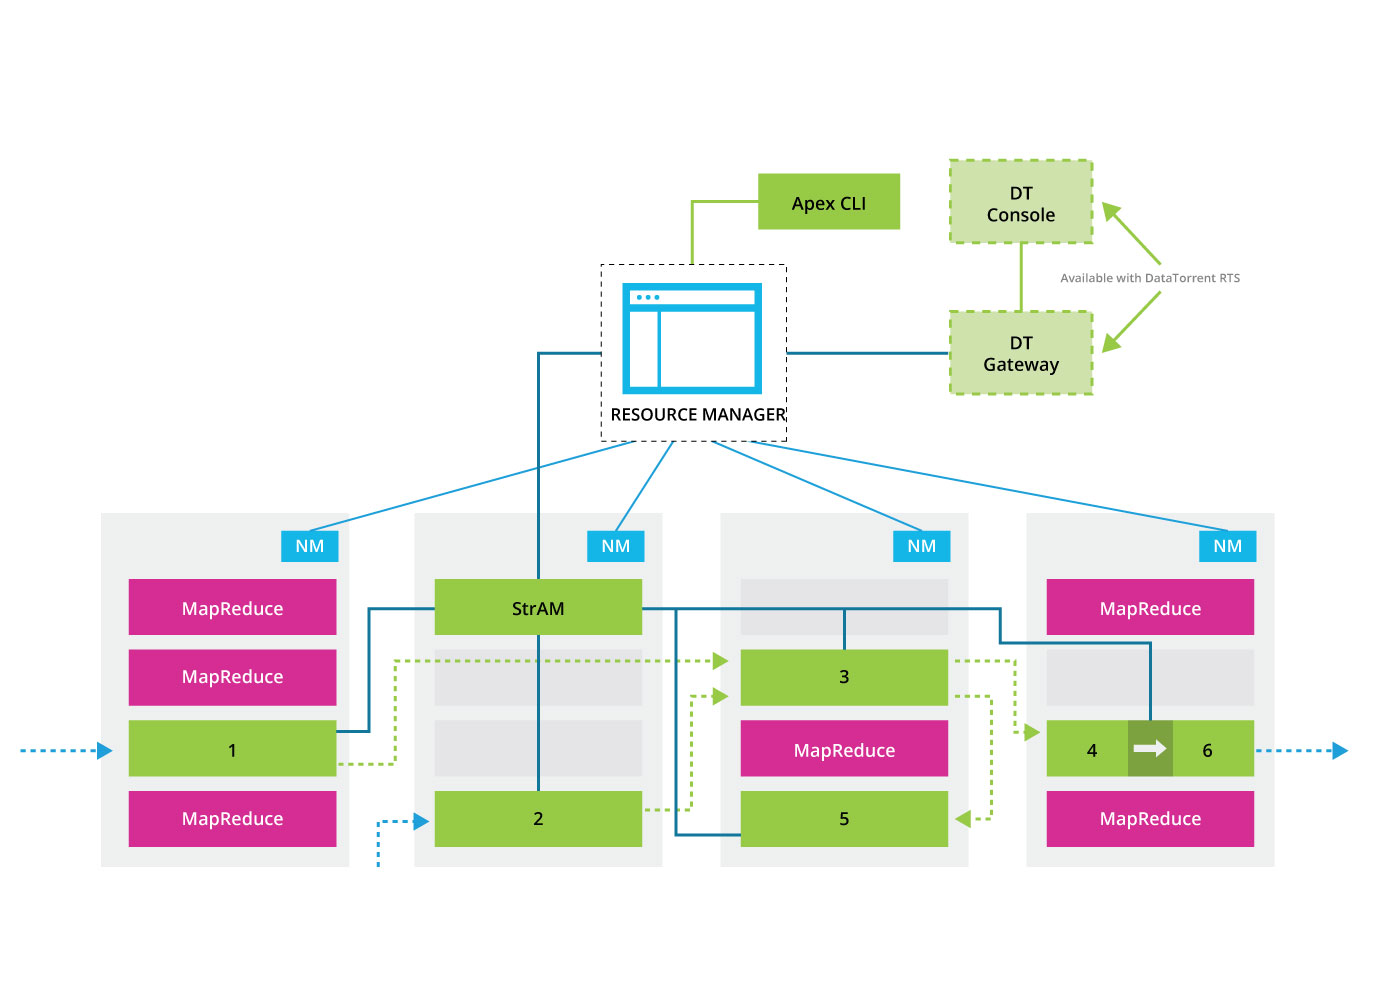
Each container provisions a buffer server ‘ the component that enables the pub sub based inter-process data flow. Once all containers are up and StrAM knows the buffer server endpoints, deployment of operators commences. The deploy instructions (and other control commands) are passed as part of the heartbeat response from StrAM to the streaming containers. There is no further scheduling or provisioning related activity unless a process fails or the operator is undeployed due to dynamic changes in the physical plan.
Deployment of operators
The container, upon receiving the operator deployment request from StrAM, will bring to life the operator from its frozen state (the initial checkpoint). It will create a separate thread for each operator, in which all user code will run (except of course in the case where operators share a thread because the user defined a stream as THREAD_LOCAL). User code comprises all the callbacks defined in the Operator interface. The nice thing about this is that the user code is not concerned with thread synchronization, thus making it easier to develop and typically more efficient to run, as the heavy lifting is left to the engine and overhead avoided.
The very first thing after operator instantiation is the (one time) call to its setup method which gives the operator the opportunity to initialize state that is required for its processing prior to connecting the streams. There is also an optional interface ActivationListener and a method activate which will be called after the operator is wired and just before window processing starts.
Now the operator is ready to process the data, framed in streaming windows. The engine will call beginWindow, then process on the respective input port(s) for every data tuple and endWindow. This will repeat until either something catastrophic happens or StrAM requests an operator undeploy due to dynamic plan changes. It is clear at this point that this lifecycle minimizes the scheduling and expense to bootstrap processing. It is a one time cost.
There are a few other things that happen between invocations of the user code, demarcated by windows. For example, checkpoints are periodically taken (every 30s by default, tunable by the user). There are also optional callbacks defined by CheckpointListener that can be used to implement synchronization with external systems (think database transactions or copy of finalized files, for example).
Monitoring the execution
Once the containers are fully provisioned, StrAM records the periodic heartbeat updates, and watches operator processing as data flows through the pipeline. StrAM does not contribute to the data flow itself, processing is decentralized and asynchronous. StrAM collects the stats from the heartbeats and uses them to provide the central view of the execution. For example, it calculates latency based on the window timestamps that are reported, which is vital in identifying processing bottlenecks. It also uses the window information to monitor the progress of operators and identify operators that are stuck (and when necessary restarts them, with an interval controllable by user). StrAM also hosts a REST API that clients such as the CLI can use to collect data. Here is an example for the information that can be obtained through this API:
  {
    "id": "3",
    "name": "counter",
    "className": "com.datatorrent.lib.algo.UniqueCounter",
    "container": "container_1443668714920_0001_01_000003",
    "host": "localhost:8052",
    "totalTuplesProcessed": "198",
    "totalTuplesEmitted": "1",
    "tuplesProcessedPSMA": "0",
    "tuplesEmittedPSMA": "0",
    "cpuPercentageMA": "1.5208279931258353",
    "latencyMA": "10",
    "status": "ACTIVE",
    "lastHeartbeat": "1443670671506",
    "failureCount": "0",
    "recoveryWindowId": "6200516265145009027",
    "currentWindowId": "6200516265145009085",
    "ports": [
      {
        "name": "data",
        "type": "input",
        "totalTuples": "198",
        "tuplesPSMA": "0",
        "bufferServerBytesPSMA": "16",
        "queueSizeMA": "1",
        "recordingId": null
      },
      {
        "name": "count",
        "type": "output",
        "totalTuples": "1",
        "tuplesPSMA": "0",
        "bufferServerBytesPSMA": "12",
        "queueSizeMA": "0",
        "recordingId": null
      }
    ],
    "unifierClass": null,
    "logicalName": "counter",
    "recordingId": null,
    "counters": null,
    "metrics": {},
    "checkpointStartTime": "1443670642472",
    "checkpointTime": "42",
    "checkpointTimeMA": "129"
  }
This blog covered the lifecycle of a DAG. Future posts will cover the inside view of the Apex engine, including checkpointing, processing semantics, partitioning and more. Watch this space!
[…] applications are specified as Directed Acyclic Graphs or DAGs. DAGs express processing logic using operators (vertices) and streams (edges), thereby providing a […]