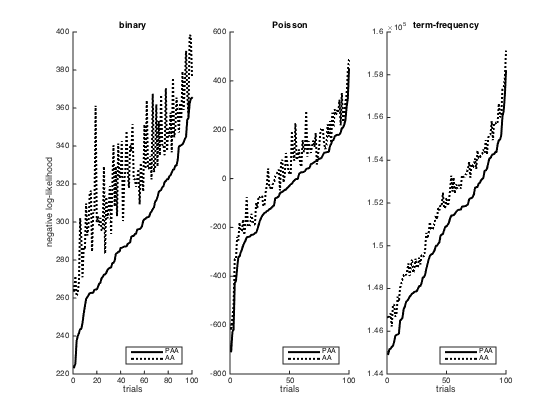
Plot negative log-likelihoods from compareProbVsDefault
Additional info: Figures 7 in article Probabilistic Archetypal Analysis by Seth and Eugster in Machine Learning Journal
Copyright Sohan Seth sohan.seth@hiit.fi
f2 = figure('papertype', 'a4', 'paperposition', [0 0 7 2]);
for count = 1:3
    switch count
        case 1
            load compareProbVsDefault_Bernoulli
        case 2
            load compareProbVsDefault_Poisson
        case 3
            load compareProbVsDefault_stochastic
    end

    figure(f2); subplot(1, 3, count), hold on
    nllList = sortrows(nllList);
    plot(nllList(:, 1), 'k', 'linewidth', 2)
    plot(real(nllList(:, 2)), 'k:', 'linewidth', 2)
    legend('PAA', 'AA', 'location', 'southeast')
    % set(gca, 'xtick', '');
    xlabel('trials')
    if count == 1; ylabel('negative log-likelihood'); end
    switch count
        case 1
            title('binary')
        case 2
            title('Poisson')
        case 3
            title('term-frequency')
    end
    set(gca, 'fontsize', 8)
end
% saveas(f2, '../../Paper-NIPS-ICML-arXiv-KDD-ML/nll.eps', 'epsc')
close all