class: center, middle, inverse, title-slide # Intro to R ### Jakub Nowosad <br><a href="mailto:nowosad.jakub@gmail.com">nowosad.jakub@gmail.com</a> ### 2017-04-24 --- [](https://www.flickr.com/photos/38463026@N04/7432529536/) ## Everything in R is an object 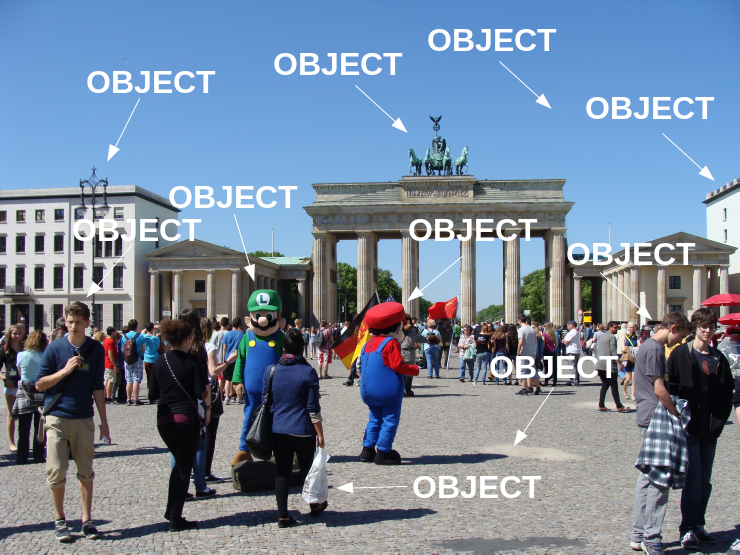 --- ## Assignment operator `<-` assigns a value to an object ```r x <- 2 x ``` ``` ## [1] 2 ``` ```r x + 3 ``` ``` ## [1] 5 ``` ```r y <- x + 3 y ``` ``` ## [1] 5 ``` --- ## Combine values `c()` combines its arguments (elements) to a one object ```r c(1, 2, 3) ``` ``` ## [1] 1 2 3 ``` ```r x <- c(1, 2, 3) x ``` ``` ## [1] 1 2 3 ``` ```r y <- x * 2 y ``` ``` ## [1] 2 4 6 ``` --- ## What does function do?  --- ## Object? ```r 2 + 2 ``` ``` ## [1] 4 ``` ```r x <- 2 x + x ``` ``` ## [1] 4 ``` ```r x <- 2 y <- x + x y ``` ``` ## [1] 4 ``` ```r x <- 2 x <- x + x x ``` ``` ## [1] 4 ``` --- ## Why do I need a package? - As of March 2017, there were over 10,000 packages on the official repository (Comprehensive R Archive Network - CRAN) - A package is a group of functions - `install.packages()` can be used to install packages from CRAN: ```r install.packages('ggplot2') ``` - You only need to install a package once! - `update.packages()` can be used to update installed packages ```r update.packages() ``` - To use a package, load it with function `library()` - Unlike `install.packages()`, you need to load selected packages everytime you run R! ```r library('ggplot2') ``` --- ## Where am I? - Working directory - Working directory is the current working directory (location on a hard drive) of the R process - Function `getwd()` returns an absolute filepath representing the current working directory: ```r getwd() ``` ``` ## [1] "/home/jn/Documents/Intro_to_R" ``` - Working directory can be changed using **Ctrl+Shift+H** shortcut in RStudio (alternatively Session -> Set Working Directory -> Choose Directory...) or a function `setwd()`: ```r setwd("home/jn/Documents/Intro_to_R/") ``` - ...in Windows: ```r setwd("C:/Users/jn/Documenty/Intro_to_R/") ``` --- ## Quo Vadis - Working directory is important, because it is allows to use a relative filepath - In most of the cases, the use of a relative filepath is recommended. It simplifies work, especially when data and code are moved between computers - Relative filepath *"data/file.rds"* ```r gap <- readRDS("data/gapminder.rds") ``` - Absolute filepath *"home/jn/Documents/Intro_to_R/data/file.rds"* ```r gap <- readRDS("/home/jn/Documents/Intro_to_R/data/gapminder.rds") ``` - ...in Windows: ```r gap <- readRDS("C:/Users/jn/Documents/Intro_to_R/data/gapminder.rds") ``` --- ## R - https://www.r-project.org/ - http://cran.rstudio.com/bin/linux/ - http://cran.rstudio.com/bin/windows/base/ - http://cran.rstudio.com/bin/macosx/  --- ## RStudio - http://www.rstudio.com/ide/download/desktop - This is an Integrated Development Environment (IDE) for R - RStudio have many useful features, such as text editor, syntax highlighting, suggested code auto-completion, and many more  --- ## Keyboard shortcut - **Alt+Shift+K** - show keyboard shortcut reference - **Ctrl+Enter** - run current line/selection - **Alt+-** - insert assignment operator <- - **Tab** - attempt completion - **F1** - show help for function at cursor - **Ctrl+Shift+C** - comment/uncomment current line/selection - **Up/Down** (in a console) - navigate candidates - **Ctrl+Shift+H** - change working directory - **Esc** - interrupt currently executing command --- ## Help me!  ###### https://www.flickr.com/photos/apelad/6845309733] --- ## Help in R ```r # if you know a function name ?mean # if you know what you want to do ??"anova" ``` - You can also look for help using the Help window or **F1** key ## Online help - [stackoverflow.com](http://stackoverflow.com/questions/tagged/r) - [RDocumentation](http://www.rdocumentation.org/) - [twitter](http://twitter.com/) - #rstats - Web search engines [Rseek](http://www.rseek.org/), [Duckduckgo](http://duckduckgo.com/), [Google](http://google.com/), [Bing](http://bing.com/), etc. --- ## R wants data!  ###### https://www.flickr.com/photos/shellewill79/5333263261/ --- ## CSV data - Reading data ```r skijumps <- read.csv2("data/skijumps.csv") skijumps <- read.csv("data/skijumps.csv") ```  - Writing data ```r write.csv(skijumps, file="data/skijumps_csv.csv") write.csv2(skijumps, file="data/skijumps_csv.csv") ``` --- ## RData format - Loading data ```r load("data/temperature.RData") ``` - Saving data ```r save(my_object, file="data/new_temperature.RData") ``` --- ## RDS format - Loading a data ```r gap <- readRDS("data/gapminder.rds") ``` - Saving a data ```r saveRDS(gap, file="data/new_gapminder.rds") ``` --- ## Data from R packages - Loading a data ```r #install.packages('ggplot2') library('ggplot2') data("midwest") midwest ``` ``` ## # A tibble: 437 × 28 ## PID county state area poptotal popdensity popwhite popblack ## <int> <chr> <chr> <dbl> <int> <dbl> <int> <int> ## 1 561 ADAMS IL 0.052 66090 1270.9615 63917 1702 ## 2 562 ALEXANDER IL 0.014 10626 759.0000 7054 3496 ## 3 563 BOND IL 0.022 14991 681.4091 14477 429 ## 4 564 BOONE IL 0.017 30806 1812.1176 29344 127 ## 5 565 BROWN IL 0.018 5836 324.2222 5264 547 ## 6 566 BUREAU IL 0.050 35688 713.7600 35157 50 ## 7 567 CALHOUN IL 0.017 5322 313.0588 5298 1 ## 8 568 CARROLL IL 0.027 16805 622.4074 16519 111 ## 9 569 CASS IL 0.024 13437 559.8750 13384 16 ## 10 570 CHAMPAIGN IL 0.058 173025 2983.1897 146506 16559 ## # ... with 427 more rows, and 20 more variables: popamerindian <int>, ## # popasian <int>, popother <int>, percwhite <dbl>, percblack <dbl>, ## # percamerindan <dbl>, percasian <dbl>, percother <dbl>, ## # popadults <int>, perchsd <dbl>, percollege <dbl>, percprof <dbl>, ## # poppovertyknown <int>, percpovertyknown <dbl>, percbelowpoverty <dbl>, ## # percchildbelowpovert <dbl>, percadultpoverty <dbl>, ## # percelderlypoverty <dbl>, inmetro <int>, category <chr> ``` --- ## My object is really classy  ###### http://littlebritain.wikia.com/wiki/File:Emily_Howard_(1).jpg --- ## Object classes - There are many classes in R - Everybody can create a new class in R! - Some function works only with object of some class - There are four basic classes in R: - Vector - Matrix - Data frame - List --- ## Vector - A vector is the simpliest R object class - A vector can be created using `c()` function ```r vector_text <- c("cat", "dog") vector_logical <- c(TRUE, FALSE) vector_numeric <- c(1, 2.35) vector_mixed <- c("cat", 2.35) ``` --- ## Vector ```r vector_text <- c("cat", "dog") vector_logical <- c(TRUE, FALSE) vector_numeric <- c(1, 2.35) vector_mixed <- c("cat", 2.35) ``` ```r class(vector_text) ``` ``` ## [1] "character" ``` ```r class(vector_logical) ``` ``` ## [1] "logical" ``` ```r class(vector_numeric) ``` ``` ## [1] "numeric" ``` ```r class(vector_mixed) ``` ``` ## [1] "character" ``` --- ## Data frame - A data frame is the most often used object class in R - Simple data frames resembles a table with rows (observations) and columns (variables) - A data frame can be also created by reading external files (such as .csv) ```r df <- data.frame(texts=c("cat", "dog"), logicals=c(TRUE, FALSE), numerics=c(1, 2.35)) df ``` ``` ## texts logicals numerics ## 1 cat TRUE 1.00 ## 2 dog FALSE 2.35 ``` --- ## Data types ```r type_text <- "dog" type_logical <- TRUE type_numeric <- 1.23 type_factor <- as.factor("dog") ``` ```r class(type_text) ``` ``` ## [1] "character" ``` ```r class(type_logical) ``` ``` ## [1] "logical" ``` ```r class(type_numeric) ``` ``` ## [1] "numeric" ``` ```r class(type_factor) ``` ``` ## [1] "factor" ``` --- ## Data types - factors ```r type_text2 <- c("dog", "cat", "mouse", "dog") type_text2 ``` ``` ## [1] "dog" "cat" "mouse" "dog" ``` ```r class(type_text2) ``` ``` ## [1] "character" ``` ```r type_factor2 <- as.factor(c("dog", "cat", "mouse", "dog")) type_factor2 ``` ``` ## [1] dog cat mouse dog ## Levels: cat dog mouse ``` ```r class(type_factor2) ``` ``` ## [1] "factor" ``` --- ## My first words  --- ## My first words ```r # install.packages('gapminder') library('gapminder') data("gapminder") ``` - The `str()` function displays the structure of an R object. It returns, for example, a class of an object, number of observations (rows), number of variables (columns), names of variables, types of variables, and first few values ```r str(gapminder) ``` ``` ## Classes 'tbl_df', 'tbl' and 'data.frame': 1704 obs. of 6 variables: ## $ country : Factor w/ 142 levels "Afghanistan",..: 1 1 1 1 1 1 1 1 1 1 ... ## $ continent: Factor w/ 5 levels "Africa","Americas",..: 3 3 3 3 3 3 3 3 3 3 ... ## $ year : int 1952 1957 1962 1967 1972 1977 1982 1987 1992 1997 ... ## $ lifeExp : num 28.8 30.3 32 34 36.1 ... ## $ pop : int 8425333 9240934 10267083 11537966 13079460 14880372 12881816 13867957 16317921 22227415 ... ## $ gdpPercap: num 779 821 853 836 740 ... ``` --- ## My first words - The `head()` function returns the first part of an object (default - a six first observations/rows) ```r head(gapminder) ``` ``` ## # A tibble: 6 × 6 ## country continent year lifeExp pop gdpPercap ## <fctr> <fctr> <int> <dbl> <int> <dbl> ## 1 Afghanistan Asia 1952 28.801 8425333 779.4453 ## 2 Afghanistan Asia 1957 30.332 9240934 820.8530 ## 3 Afghanistan Asia 1962 31.997 10267083 853.1007 ## 4 Afghanistan Asia 1967 34.020 11537966 836.1971 ## 5 Afghanistan Asia 1972 36.088 13079460 739.9811 ## 6 Afghanistan Asia 1977 38.438 14880372 786.1134 ``` --- ## My first words - The `summary()` function displays summaries of the results - This summary depends on a type of variable, for example a minimum, first quartile, median, mean, third quartile, and maximum is returned for numerical variables and a number of observation is returned for factor variables ```r summary(gapminder) ``` ``` ## country continent year lifeExp ## Afghanistan: 12 Africa :624 Min. :1952 Min. :23.60 ## Albania : 12 Americas:300 1st Qu.:1966 1st Qu.:48.20 ## Algeria : 12 Asia :396 Median :1980 Median :60.71 ## Angola : 12 Europe :360 Mean :1980 Mean :59.47 ## Argentina : 12 Oceania : 24 3rd Qu.:1993 3rd Qu.:70.85 ## Australia : 12 Max. :2007 Max. :82.60 ## (Other) :1632 ## pop gdpPercap ## Min. :6.001e+04 Min. : 241.2 ## 1st Qu.:2.794e+06 1st Qu.: 1202.1 ## Median :7.024e+06 Median : 3531.8 ## Mean :2.960e+07 Mean : 7215.3 ## 3rd Qu.:1.959e+07 3rd Qu.: 9325.5 ## Max. :1.319e+09 Max. :113523.1 ## ``` --- ## How to start?  ###### https://www.flickr.com/photos/cogdog/5528772562 --- ## How to start? Create a new RStudio project: 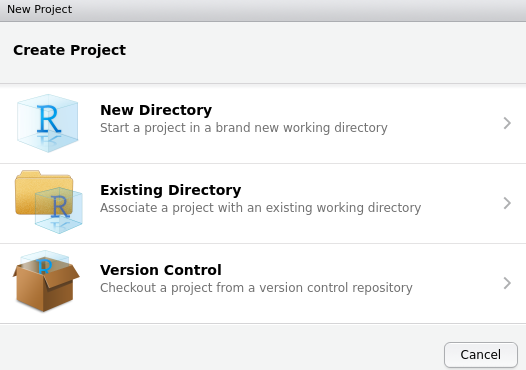 - All the files in a one place (**integrity**) - Easy to move between computers (**portability**) - Integration with version control systems - git and svn (**shareability**) --- ## How to start? Project' structure (starting point): ```bash project/ - README.Rmd # Project description - R/ # For R code - 01_data_download.R - 02_data_processing.R - 03_plots.R - data/ # Preprocessed data - water_quality_cleaned.rds - landcover_wgs84.tif - raw_data/ # Original data - water_quality.csv - landcover.tif - text/ # Description of the results + figures - water_quality.tex - figs/ - 01_study_area.png - 02_boxplots.png ``` --- ## What's next? <!--https://blog.datazar.com/the-5-most-effective-ways-to-learn-r-d4cfdf0d524 --> - [R news and tutorials contributed by R bloggers](https://www.r-bloggers.com/) - a blog aggregator - [RStudio Cheat Sheets](https://www.rstudio.com/resources/cheatsheets/) - various cheet sheets - from data import/export to specific applications - [R for cats](https://rforcats.net/) - meow... - [try R](http://tryr.codeschool.com/) - a gentle interactive introduction to R - [introducing R to a non-programmer in one hour](http://alyssafrazee.com/introducing-R.html) - it's possible! - [R for Data Science](http://r4ds.had.co.nz/) - a great book which contains chapters for beginners and for more advanced users - [Efficient R programming](https://csgillespie.github.io/efficientR/) - aka how to be more efficient working with R - [R is for archaeology](https://electricarchaeology.ca/2017/04/11/r-is-for-archaeology-a-report-on-the-2017-society-of-american-archaeology-meeting-by-b-marwick/) - R is not only used by statisticians - [60+ R resources to improve your data skills](http://www.computerworld.com/article/2497464/business-intelligence/business-intelligence-60-r-resources-to-improve-your-data-skills.html) - a way longer list of great resources