True Signal vs Correlated Null
Lei Sun
2017-03-29
Introduction
We’ve shown that in many real data sets when we have correlated null \(z\) scores, we can fit their empirical distribution with Gaussian and its derivatives.
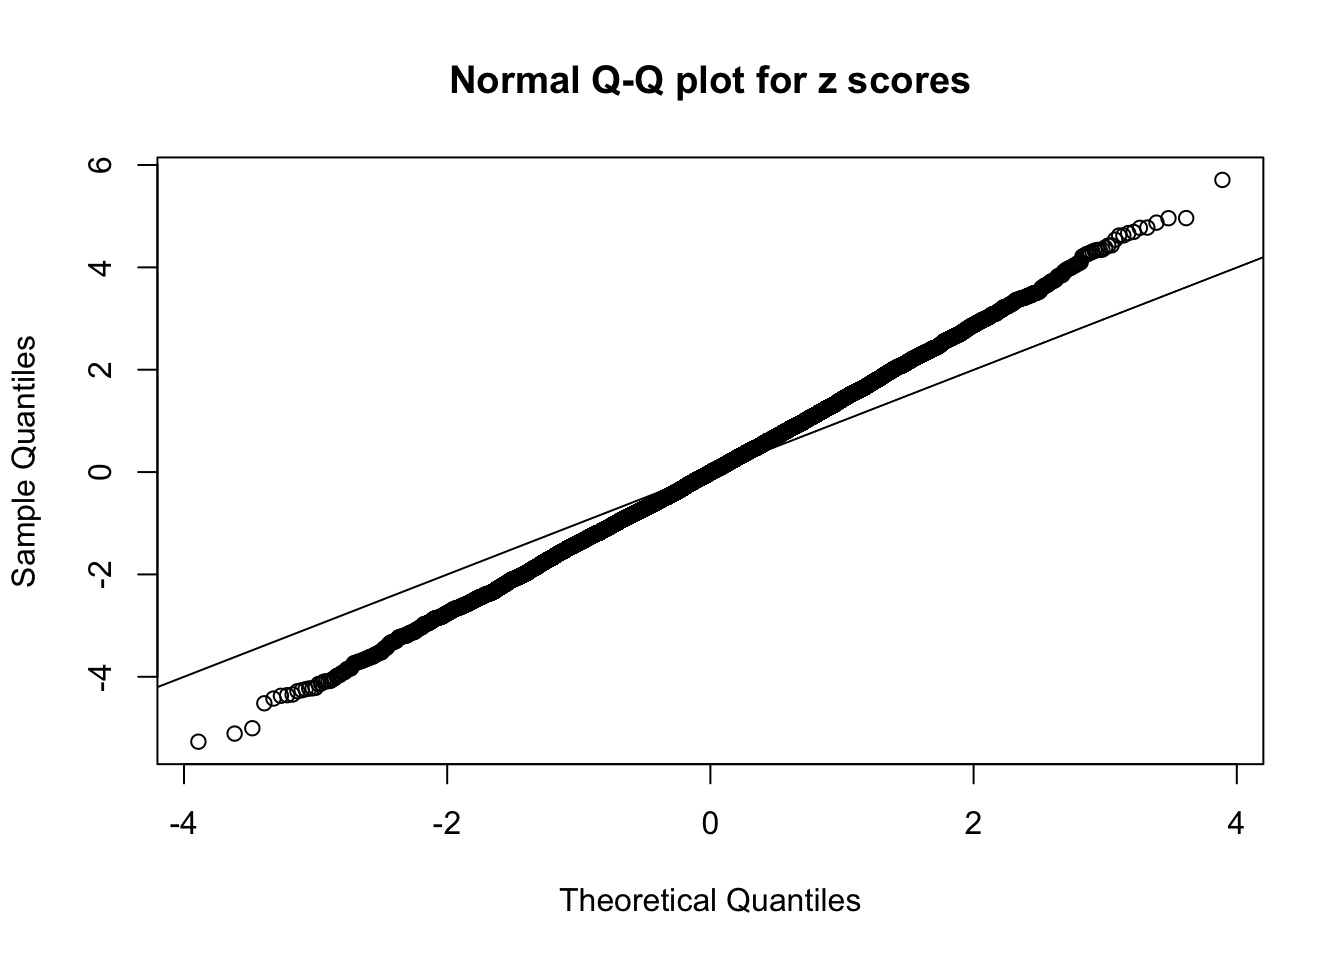
But what if we have real signals instead of the global null? Can we fit real signals with Gaussian derivatives with reasonable weights? Let’s start with the most basic case: \(z \sim N(0, \sqrt{2}^2)\) independently. This data set can be seen as generated as follows.
\[ \begin{array}{c} \beta_j \sim N(0, 1)\\ z_j \sim N(\beta_j, 1) \end{array} \]
Illustration
Let normalized weights \(w_k^s = w_k\sqrt{k!}\) with variance \(\text{var}(w_k^s) = \alpha_k = \bar{\rho_{ij}^k}\).
n = 1e4
m = 5
set.seed(777)
zmat = matrix(rnorm(n * m, 0, sd = sqrt(2)), nrow = m)
library(ashr)
source("../code/ecdfz.R")
res = list()
for (i in 1:3) {
z = zmat[i, ]
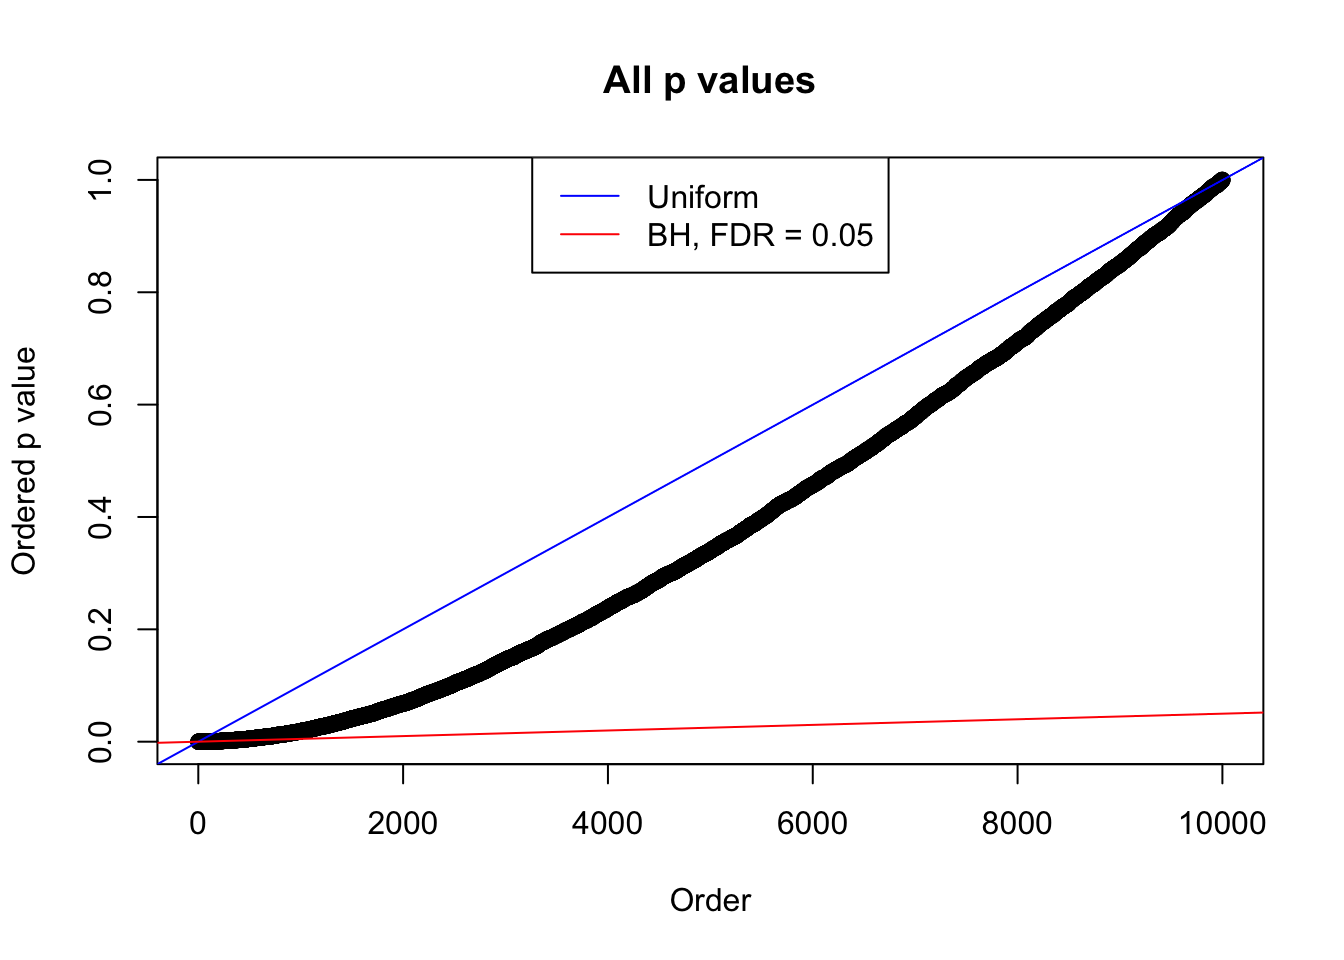
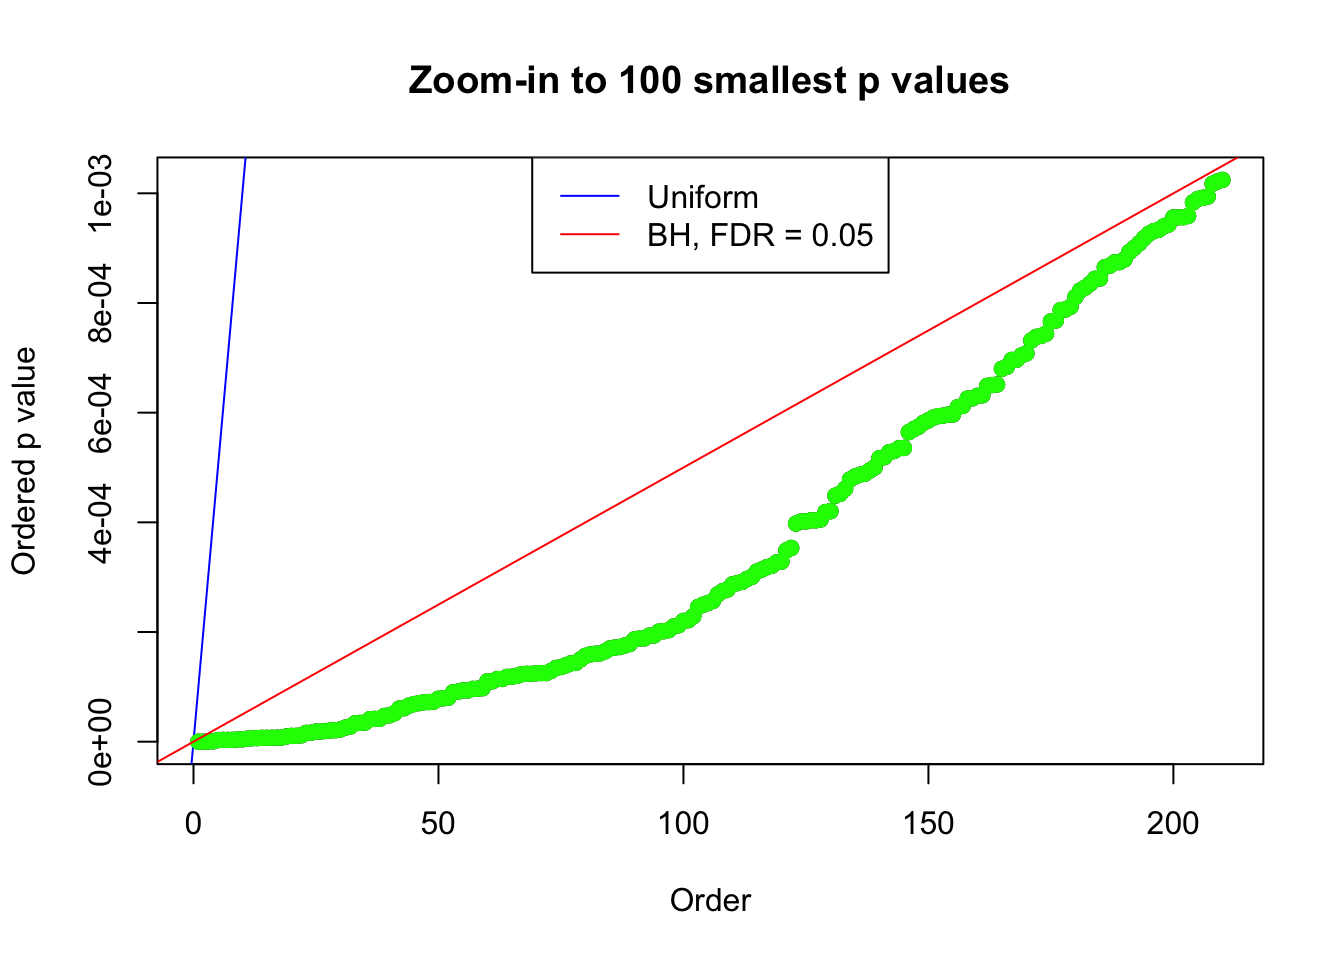
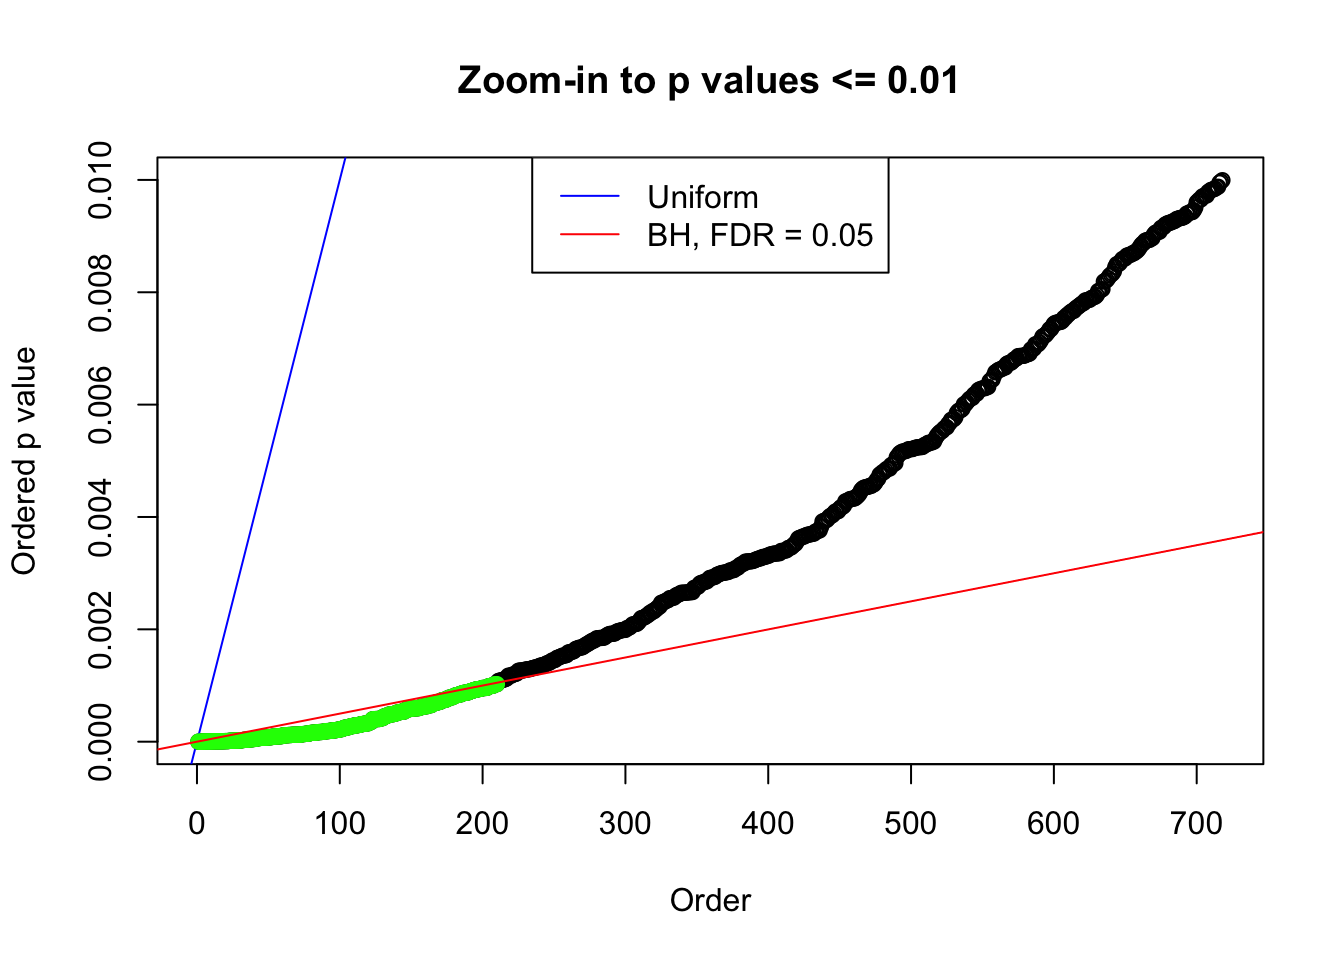
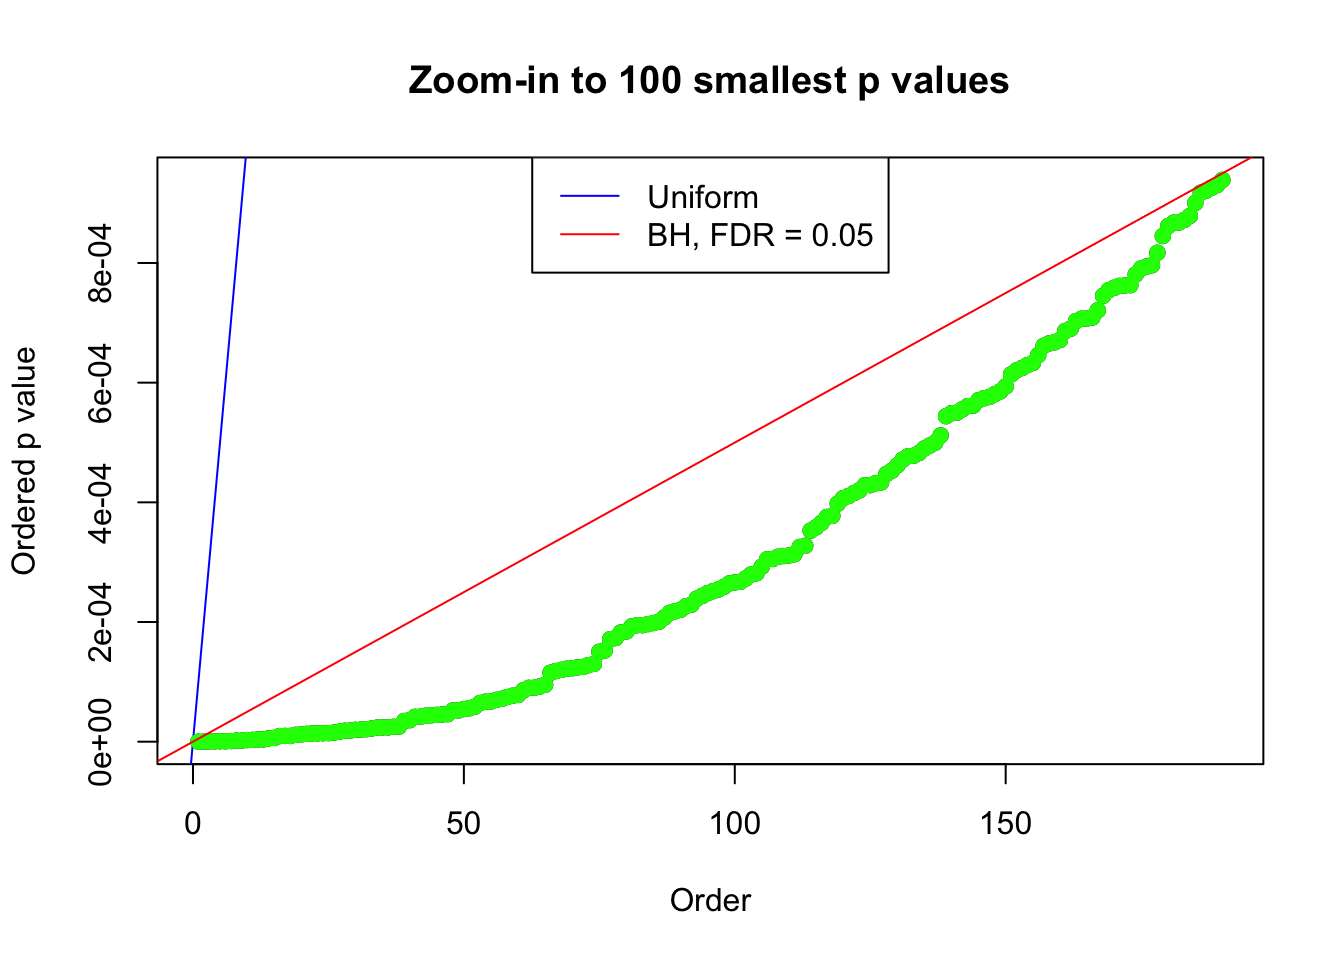
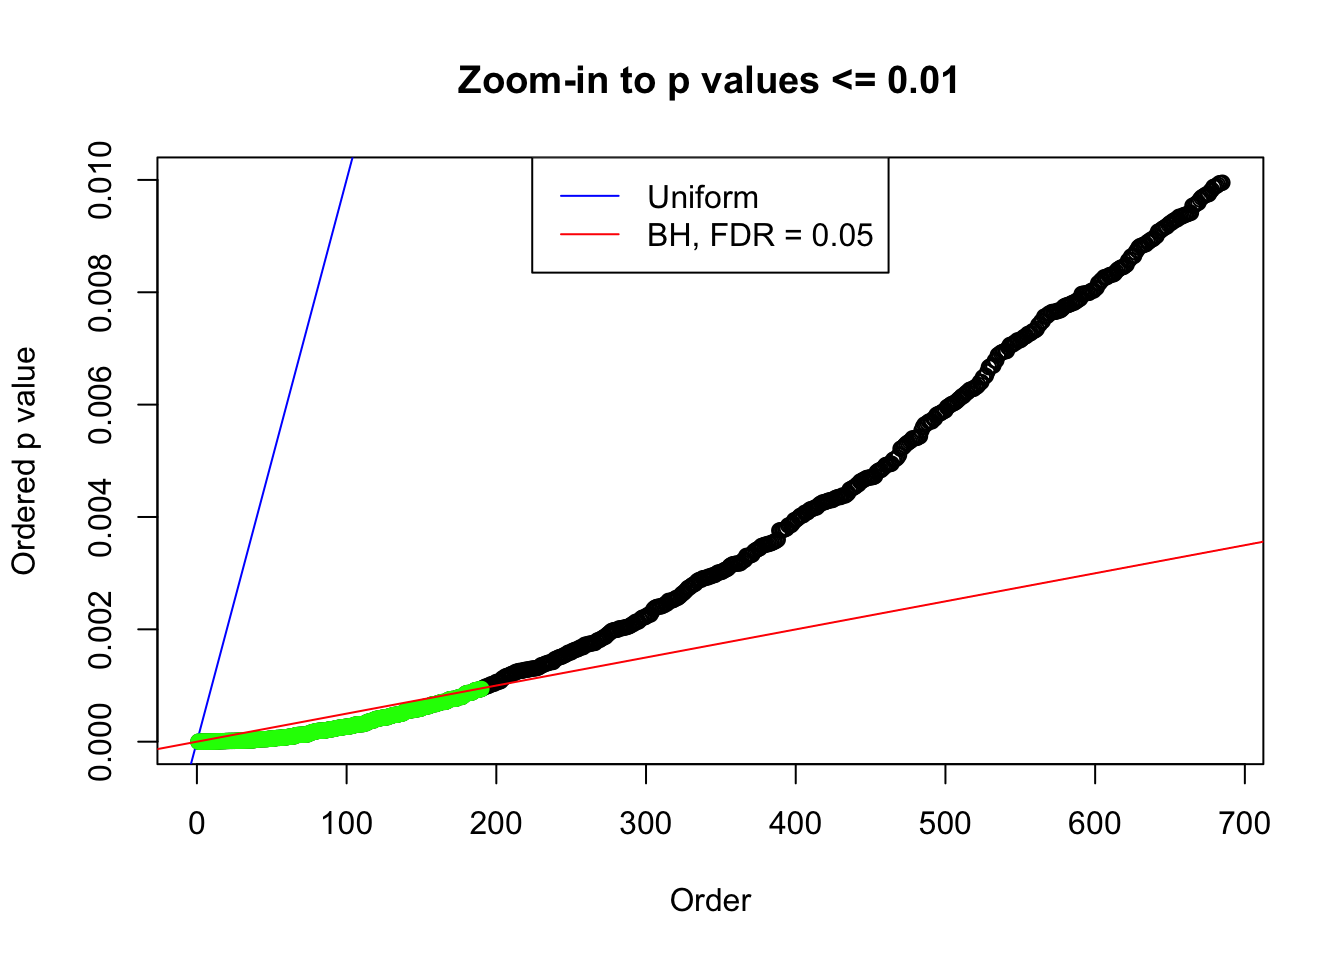
p = (1 - pnorm(abs(z))) * 2
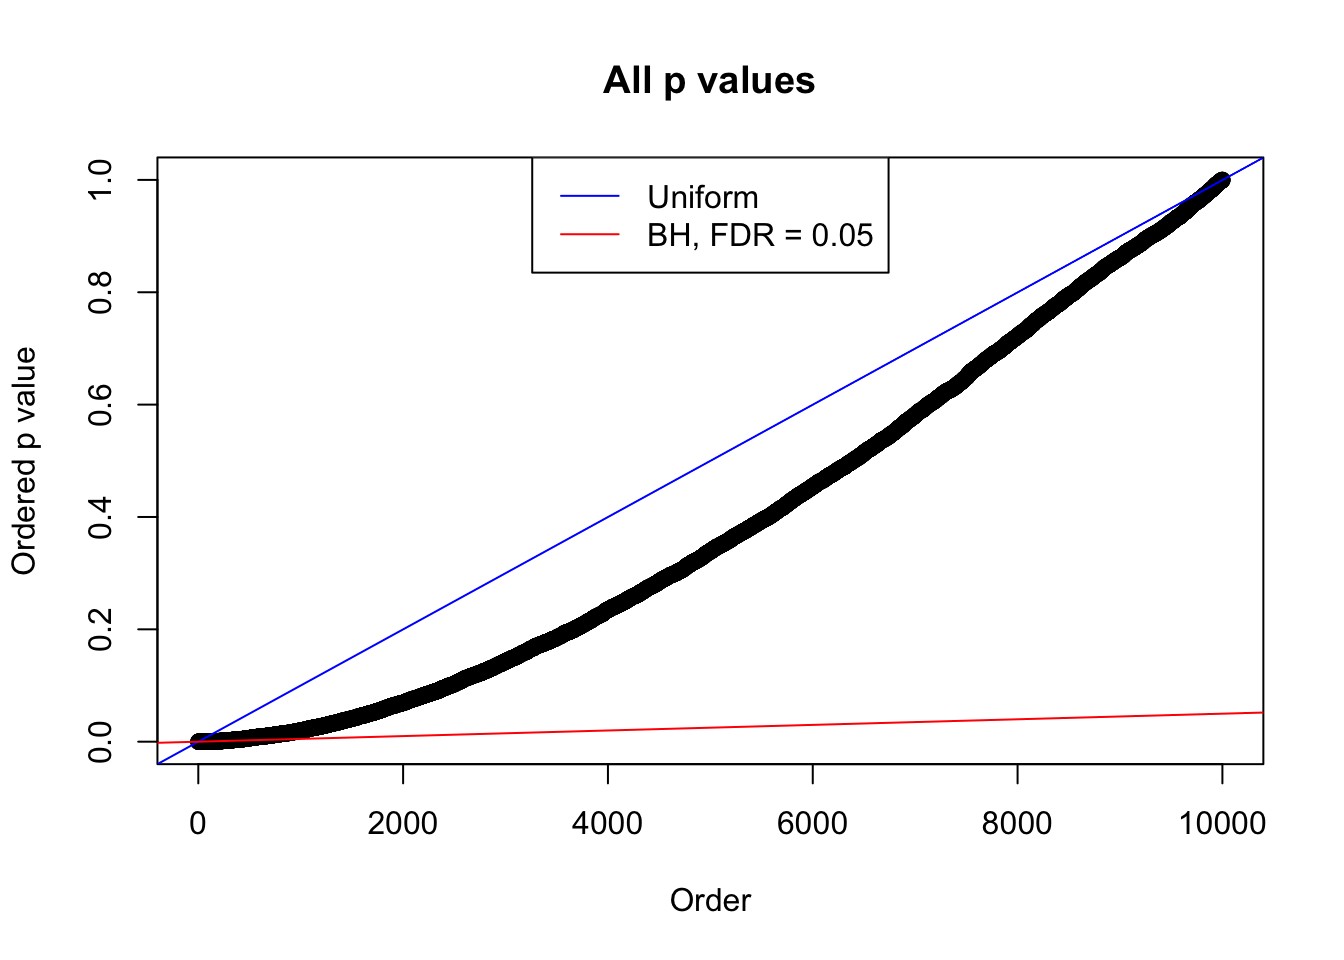
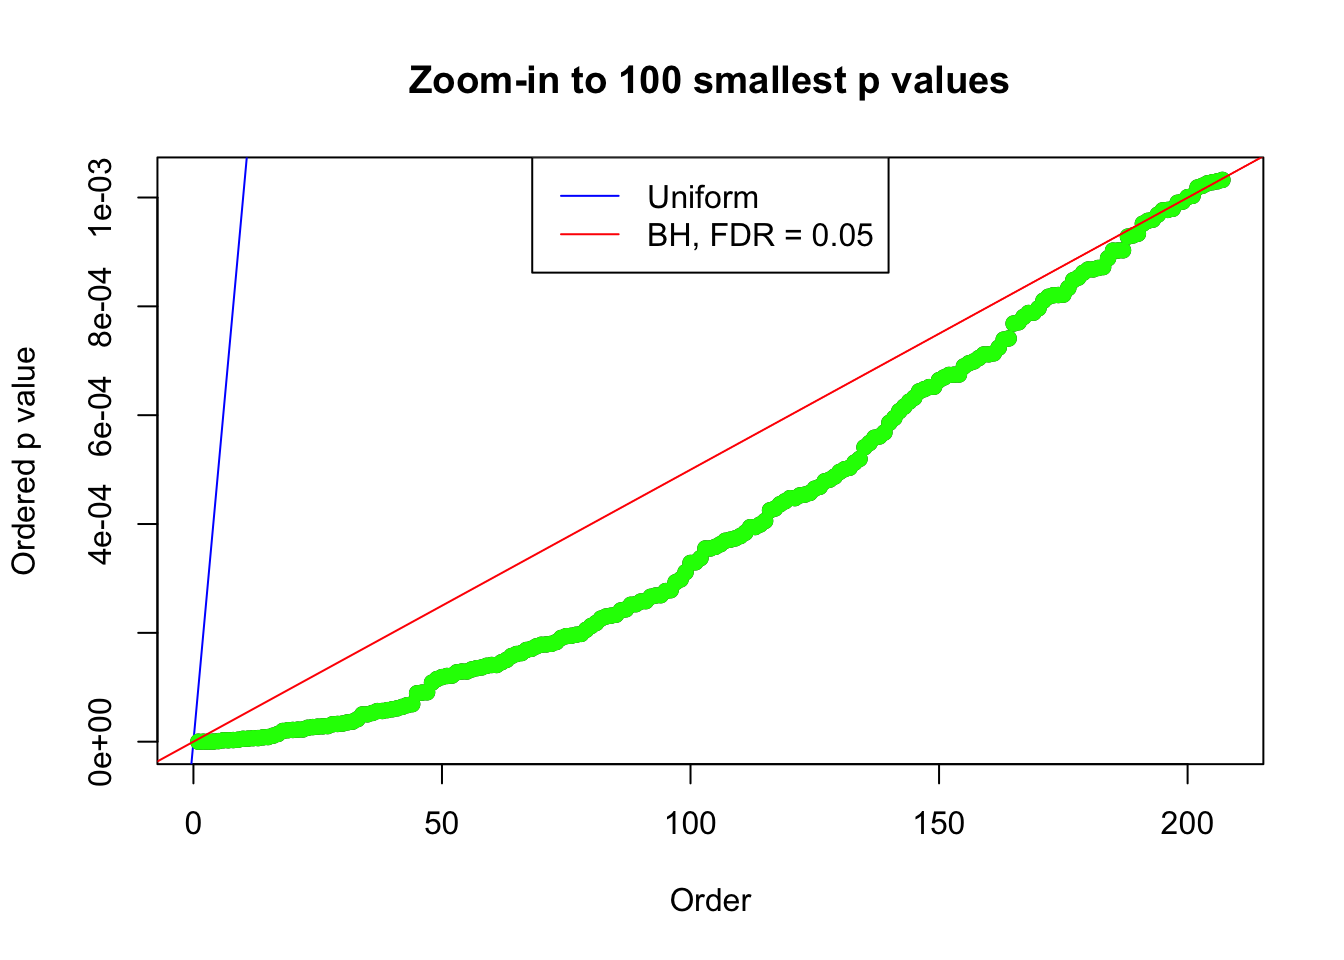
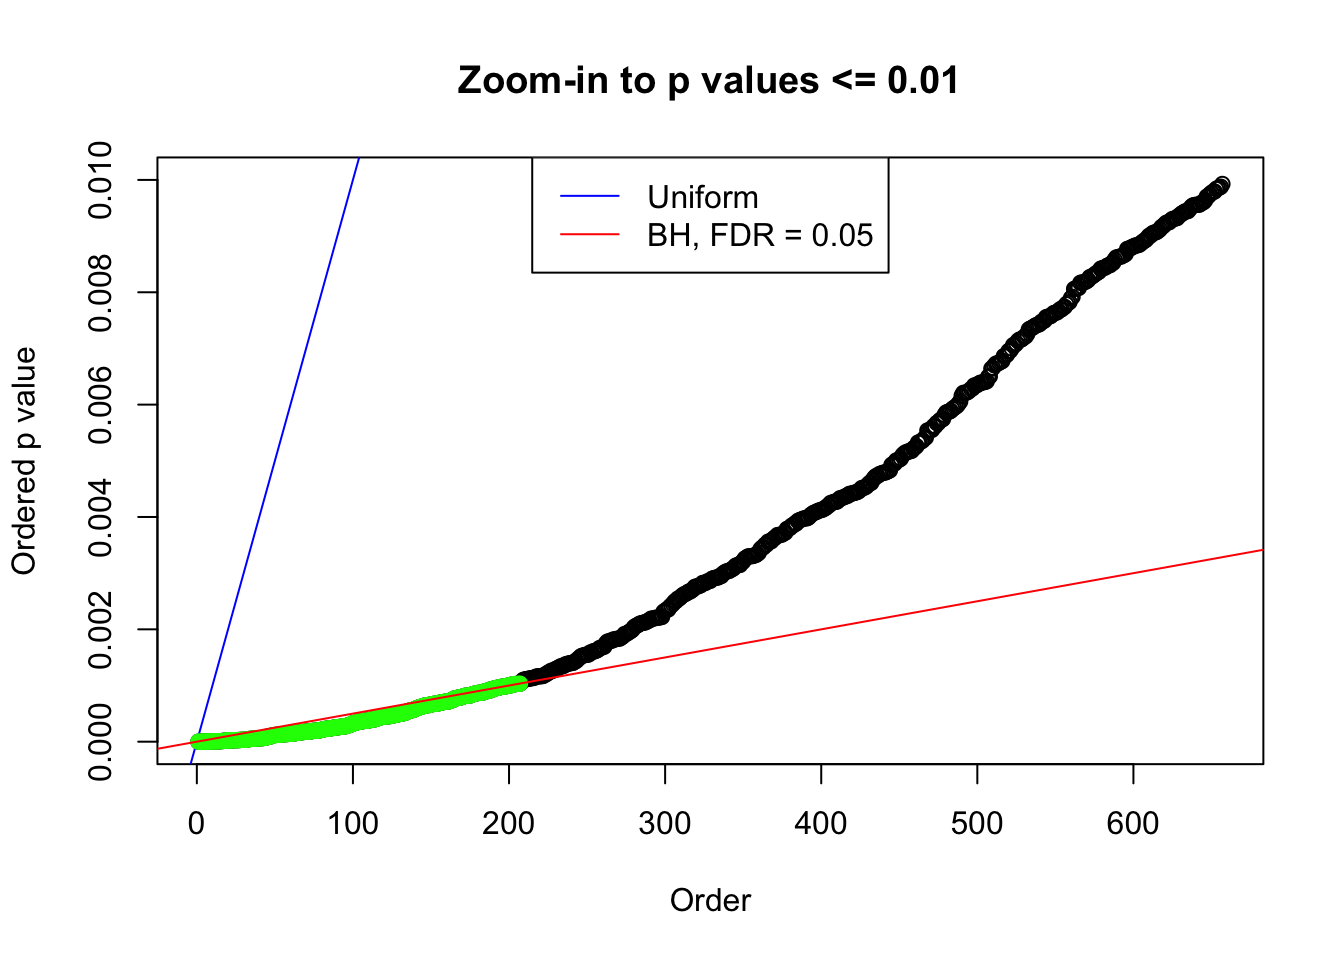
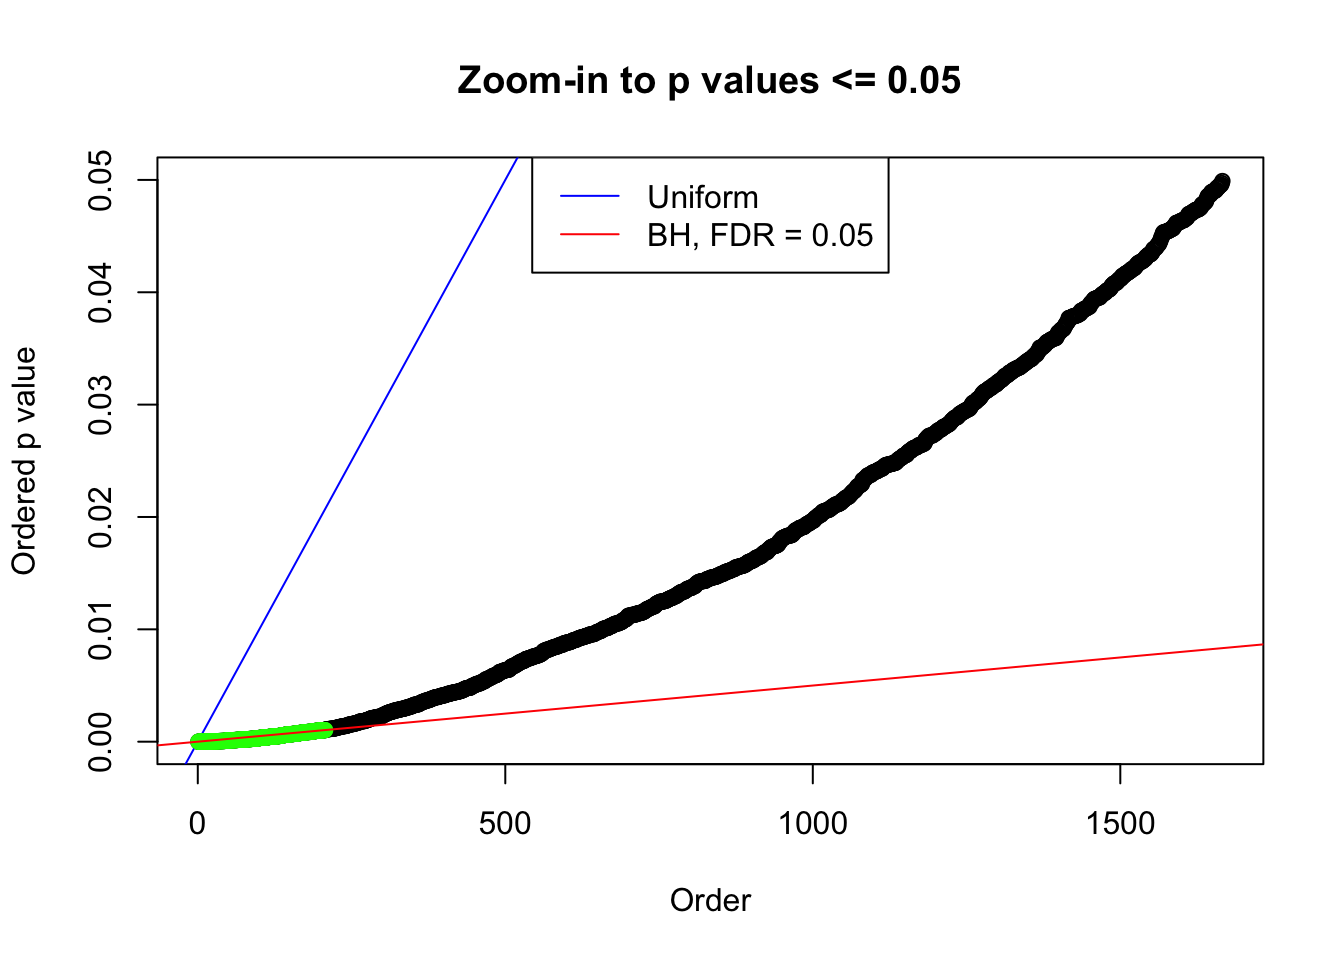
bh.fd = sum(p.adjust(p, method = "BH") <= 0.05)
pihat0.ash = get_pi0(ash(z, 1, method = "fdr"))
ecdfz.fit = ecdfz.optimal(z)
res[[i]] = list(z = z, p = p, bh.fd = bh.fd, pihat0.ash = pihat0.ash, ecdfz.fit = ecdfz.fit)
}Number of Discoveries: 207 ; pihat0 = 0.3309512
Log-likelihood with N(0, 2): -17629.27
Log-likelihood with Gaussian Derivatives: -17634.06
Normalized weights:
1 : -0.0177035771860527 ; 2 : 0.689887136368602 ; 3 : -0.0509478089605657 ; 4 : 0.474815572091947 ; 5 : -0.0255292356243276 ; 6 : 0.197260355735445 ; 7 : 0.0209642526780779 ;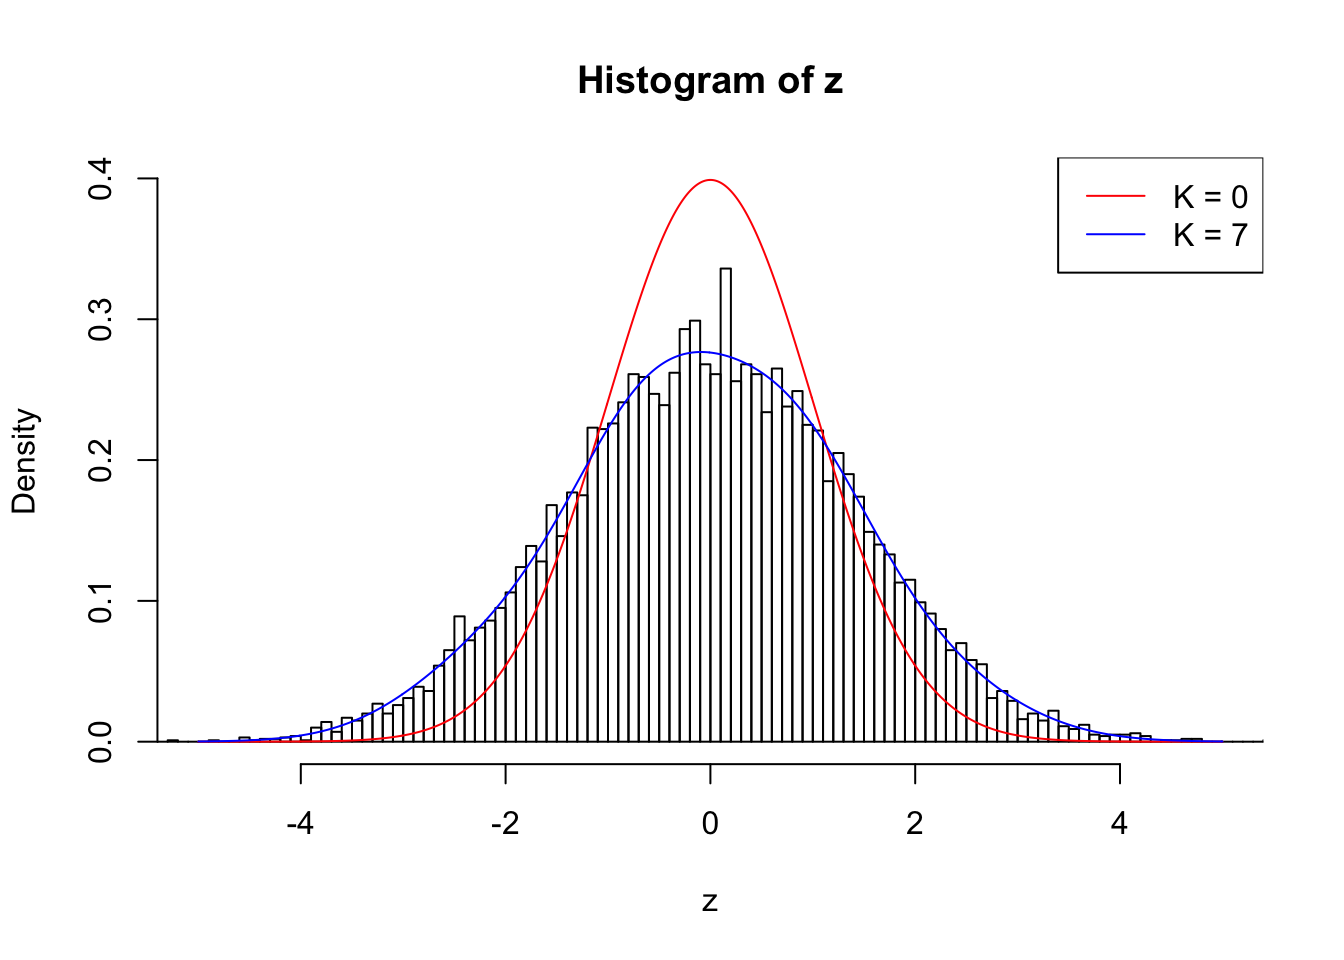
Zoom in to the positive tails: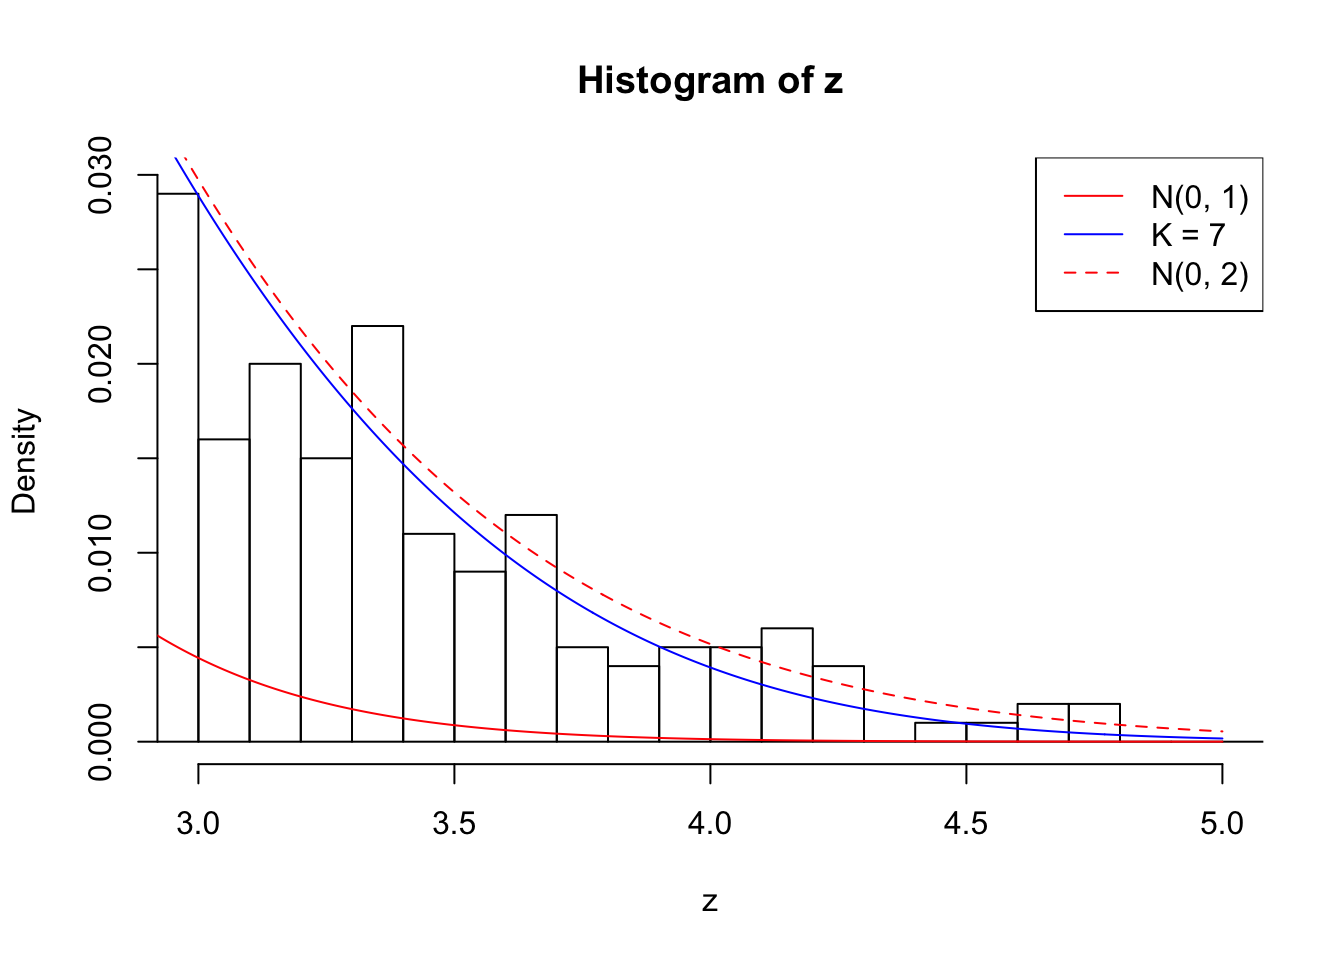
Zoom in to the negative tails: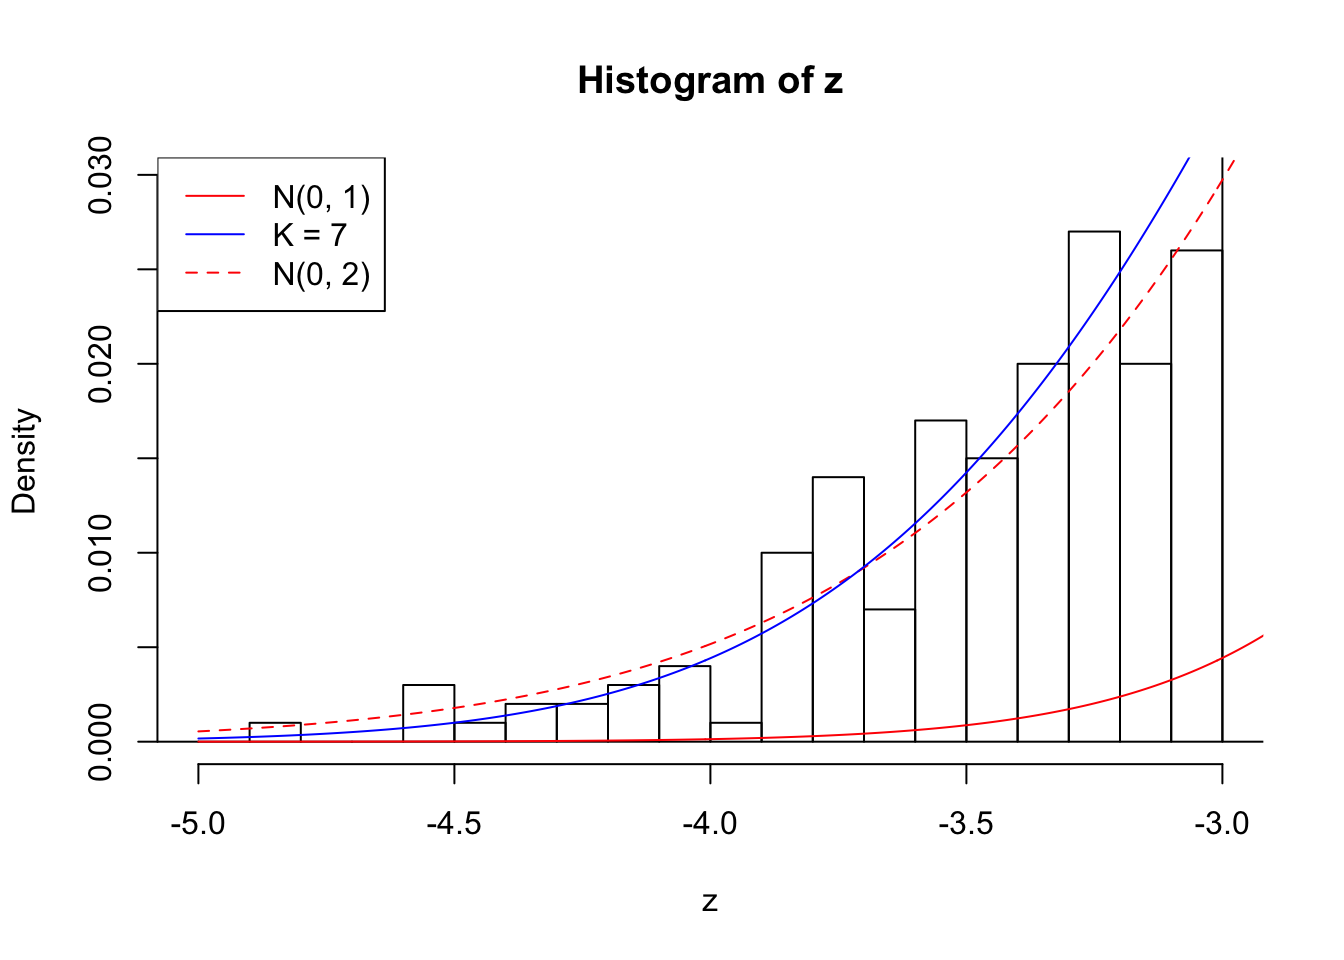
Number of Discoveries: 210 ; pihat0 = 0.3484933
Log-likelihood with N(0, 2): -17695.54
Log-likelihood with Gaussian Derivatives: -17696.16
Normalized weights:
1 : -0.00737514574580675 ; 2 : 0.710989131104057 ; 3 : -0.0342447864738427 ; 4 : 0.555898827287519 ; 5 : -0.00986066214392825 ; 6 : 0.26603682769249 ; 7 : 0.0306361333022764 ;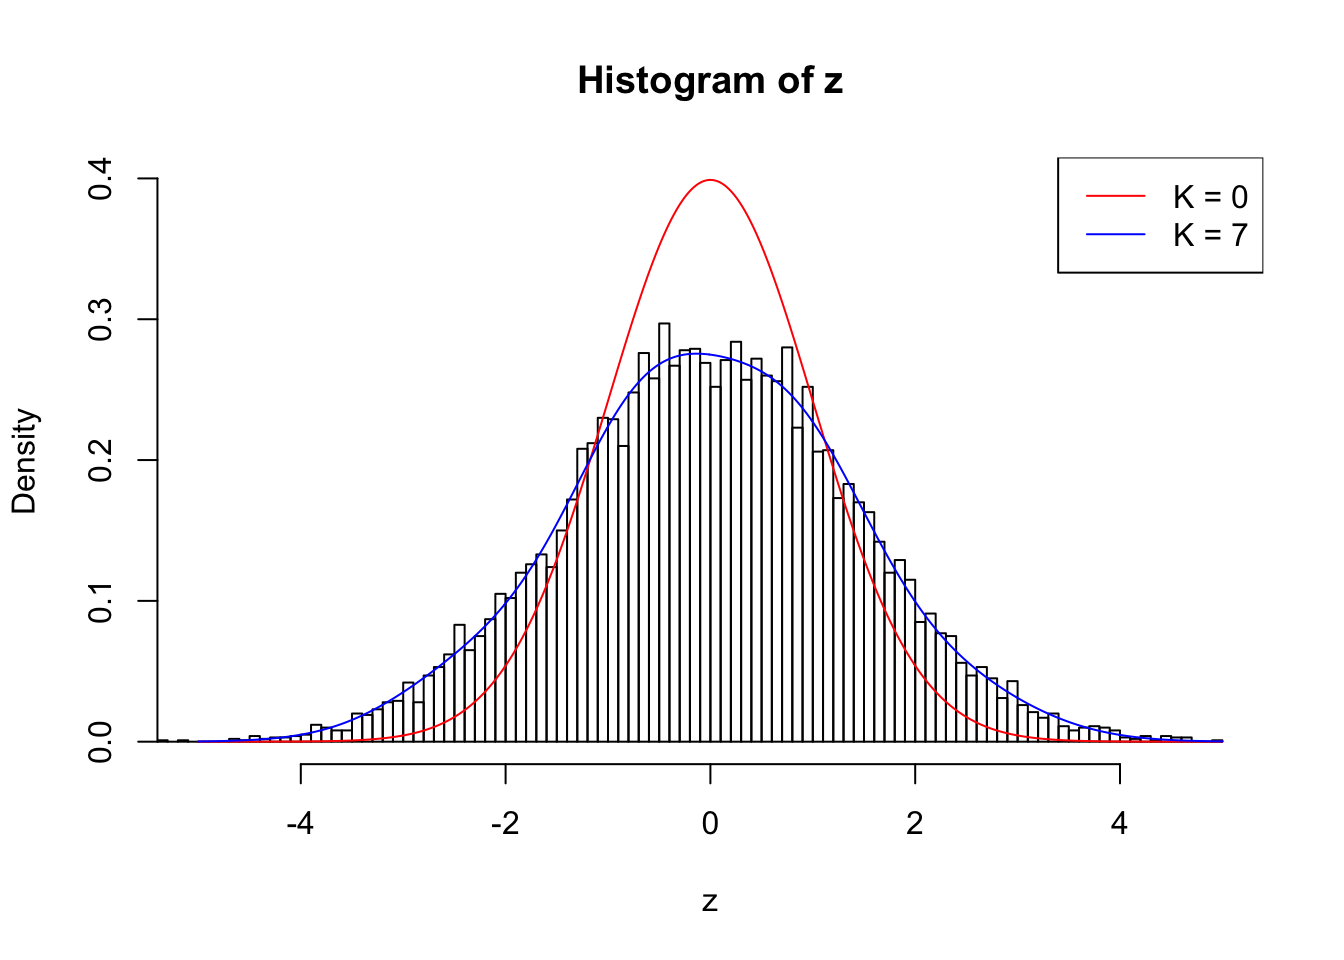
Zoom in to the positive tails: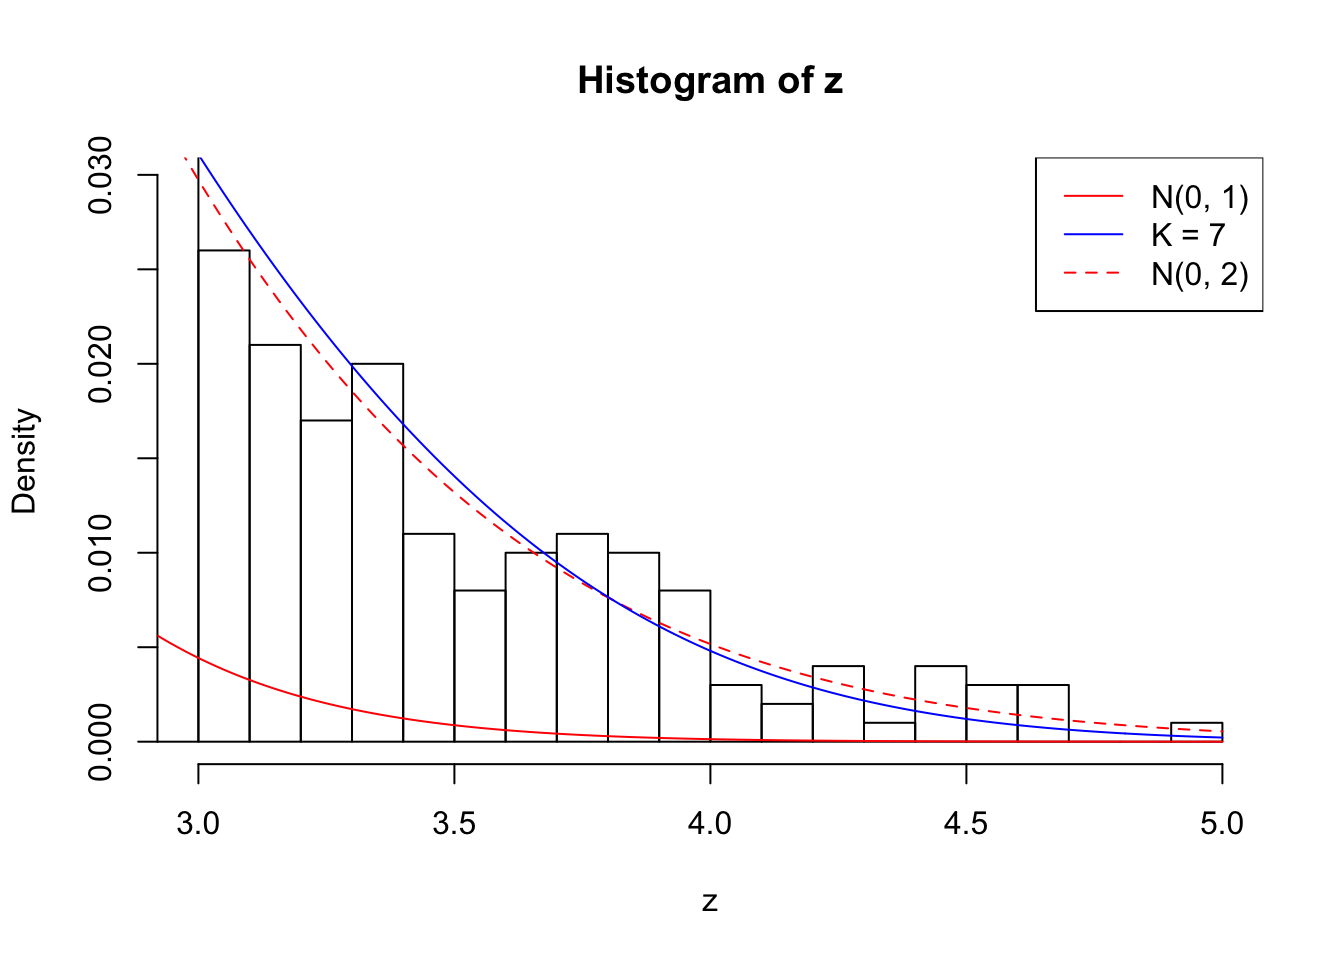
Zoom in to the negative tails: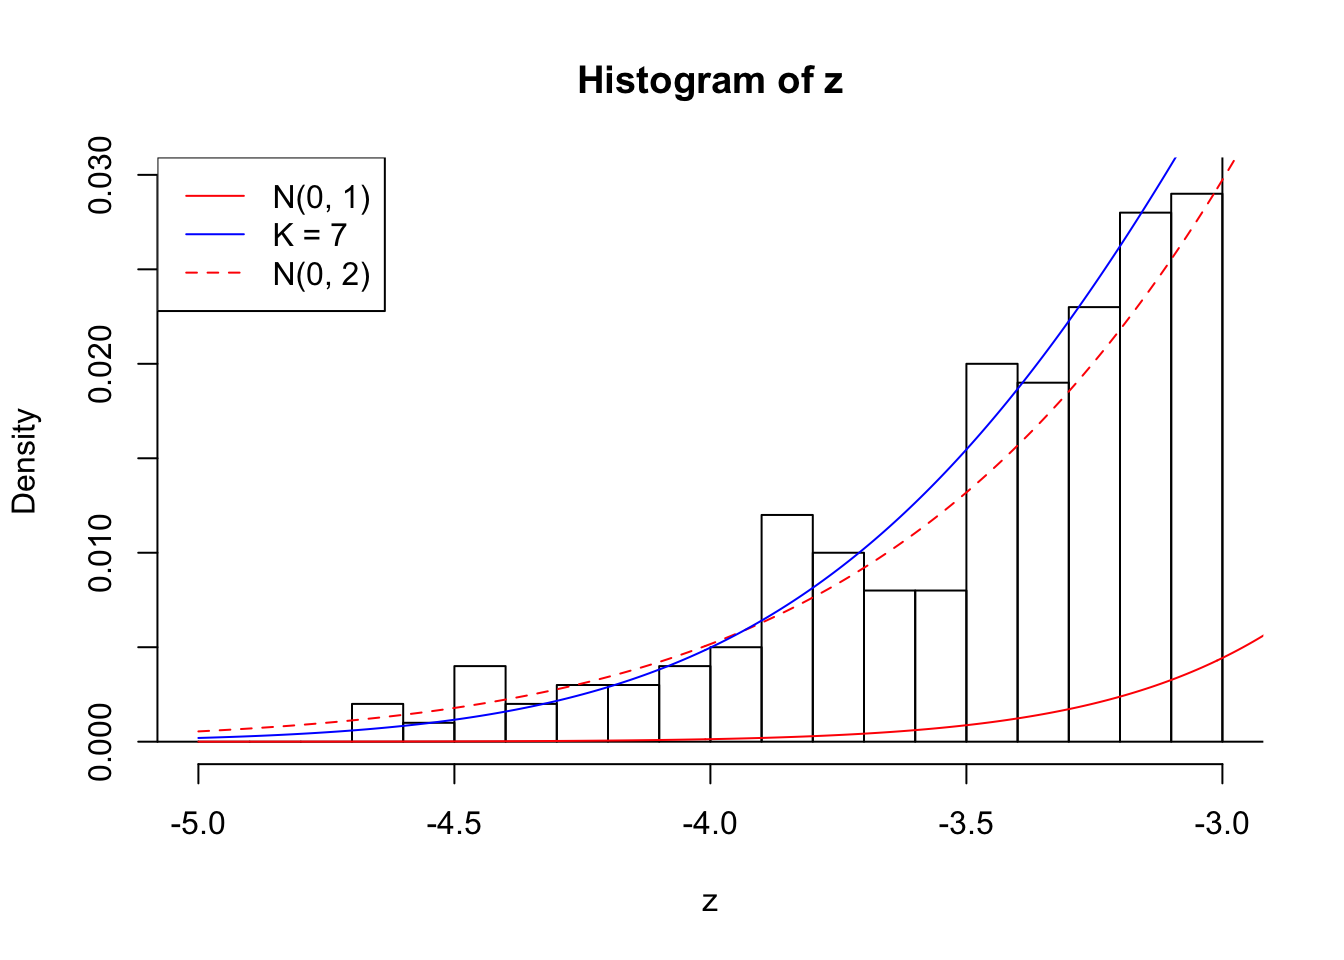

Number of Discoveries: 190 ; pihat0 = 0.3438938
Log-likelihood with N(0, 2): -17620.41
Log-likelihood with Gaussian Derivatives: -17625.35
Normalized weights:
1 : 0.00366309861970015 ; 2 : 0.686706854397367 ; 3 : 0.0586825498559195 ; 4 : 0.519903434456322 ; 5 : 0.0632968145789646 ; 6 : 0.230863448021081 ; 7 : 0.0428429372260126 ;
Zoom in to the positive tails: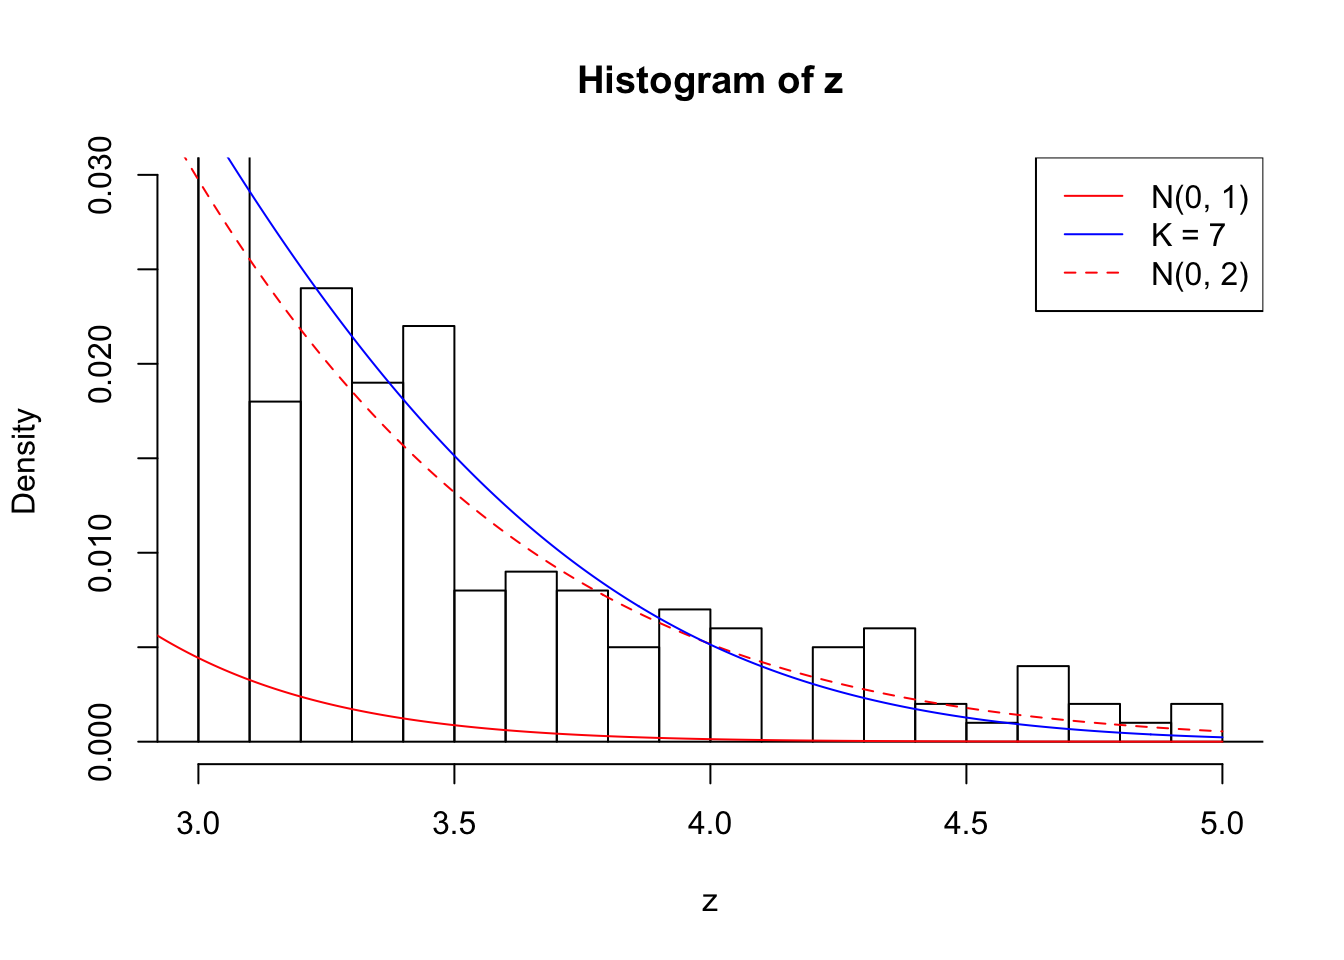
Zoom in to the negative tails: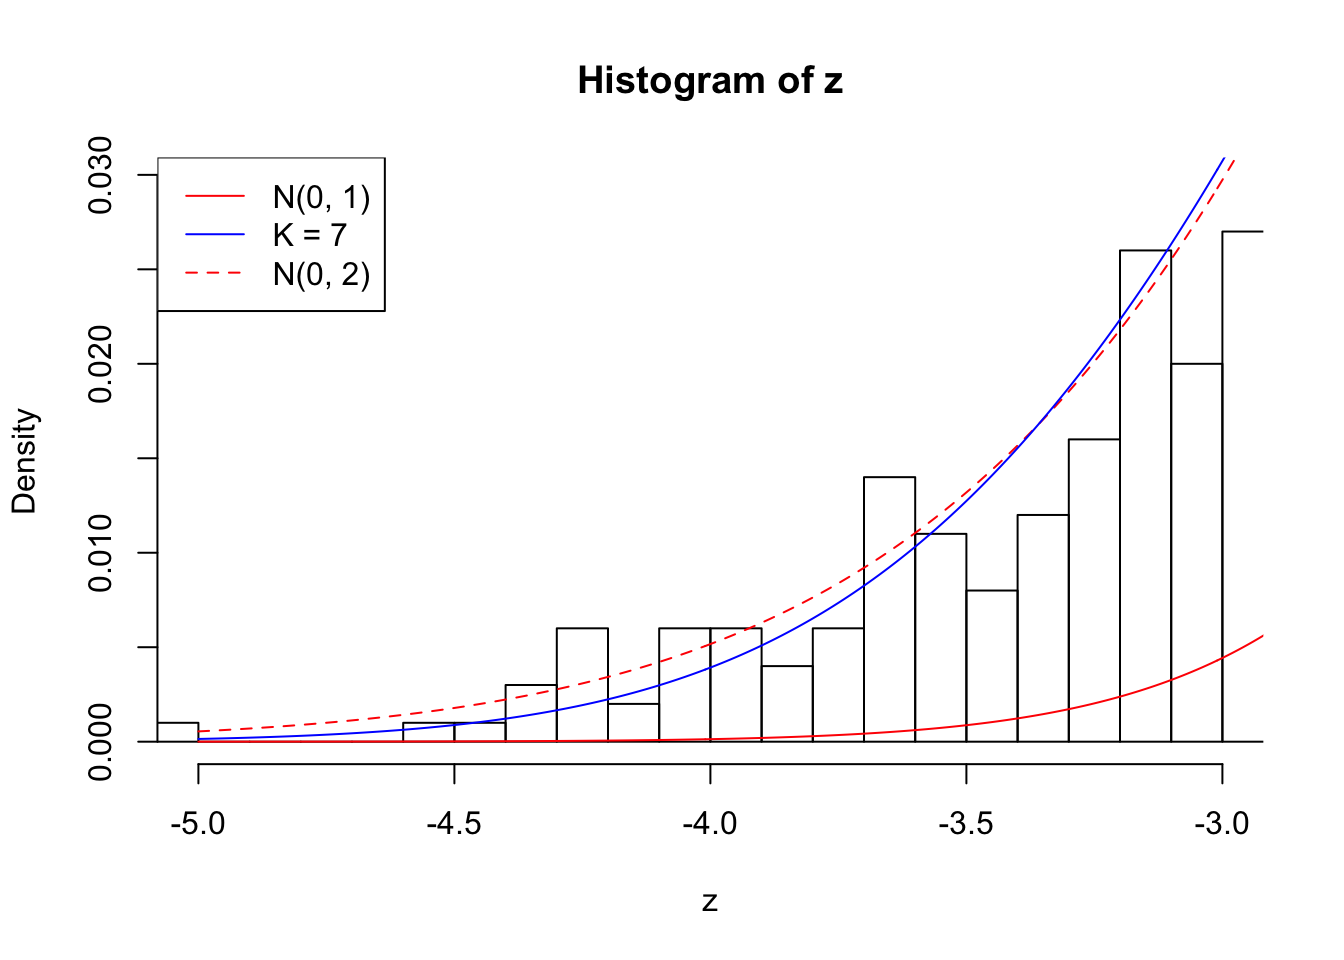


Session information
sessionInfo()R version 3.3.2 (2016-10-31)
Platform: x86_64-apple-darwin13.4.0 (64-bit)
Running under: macOS Sierra 10.12.3
locale:
[1] en_US.UTF-8/en_US.UTF-8/en_US.UTF-8/C/en_US.UTF-8/en_US.UTF-8
attached base packages:
[1] stats graphics grDevices utils datasets methods base
other attached packages:
[1] cvxr_0.0.0.9009 EQL_1.0-0 ttutils_1.0-1 ashr_2.1.5
loaded via a namespace (and not attached):
[1] Rcpp_0.12.10 knitr_1.15.1 magrittr_1.5
[4] MASS_7.3-45 doParallel_1.0.10 pscl_1.4.9
[7] SQUAREM_2016.10-1 lattice_0.20-34 foreach_1.4.3
[10] stringr_1.1.0 tools_3.3.2 parallel_3.3.2
[13] grid_3.3.2 htmltools_0.3.5 iterators_1.0.8
[16] yaml_2.1.14 rprojroot_1.2 digest_0.6.9
[19] Matrix_1.2-7.1 codetools_0.2-15 evaluate_0.10
[22] rmarkdown_1.3 stringi_1.1.2 backports_1.0.5
[25] truncnorm_1.0-7 This R Markdown site was created with workflowr