The Distribution of \(W_j\)
Lei Sun
2018-04-13
Last updated: 2018-05-06
Code version: 0b0a394
source("../code/gdash_lik.R")
source("../code/gdfit.R")
source("../code/count_to_summary.R")
library(limma)
library(edgeR)
library(ashr)
library(plyr)
library(ggplot2)
library(reshape2)
Introduction
Simulated Data
set.seed(777)
d <- 10
n <- 1e4
B <- matrix(rnorm(n * d), n, d)
Sigma <- B %*% t(B) + diag(n)
sigma <- diag(Sigma)
Rho <- cov2cor(Sigma)
rhobar <- c()
for (l in 1 : 10) {
  rhobar[l] <- (sum(Rho^l) - n) / (n * (n - 1))
}
par(mar = c(5.1, 4.1, 1, 2.1))
hist(Rho[lower.tri(Rho)], xlab = expression(rho[ij]), main = "")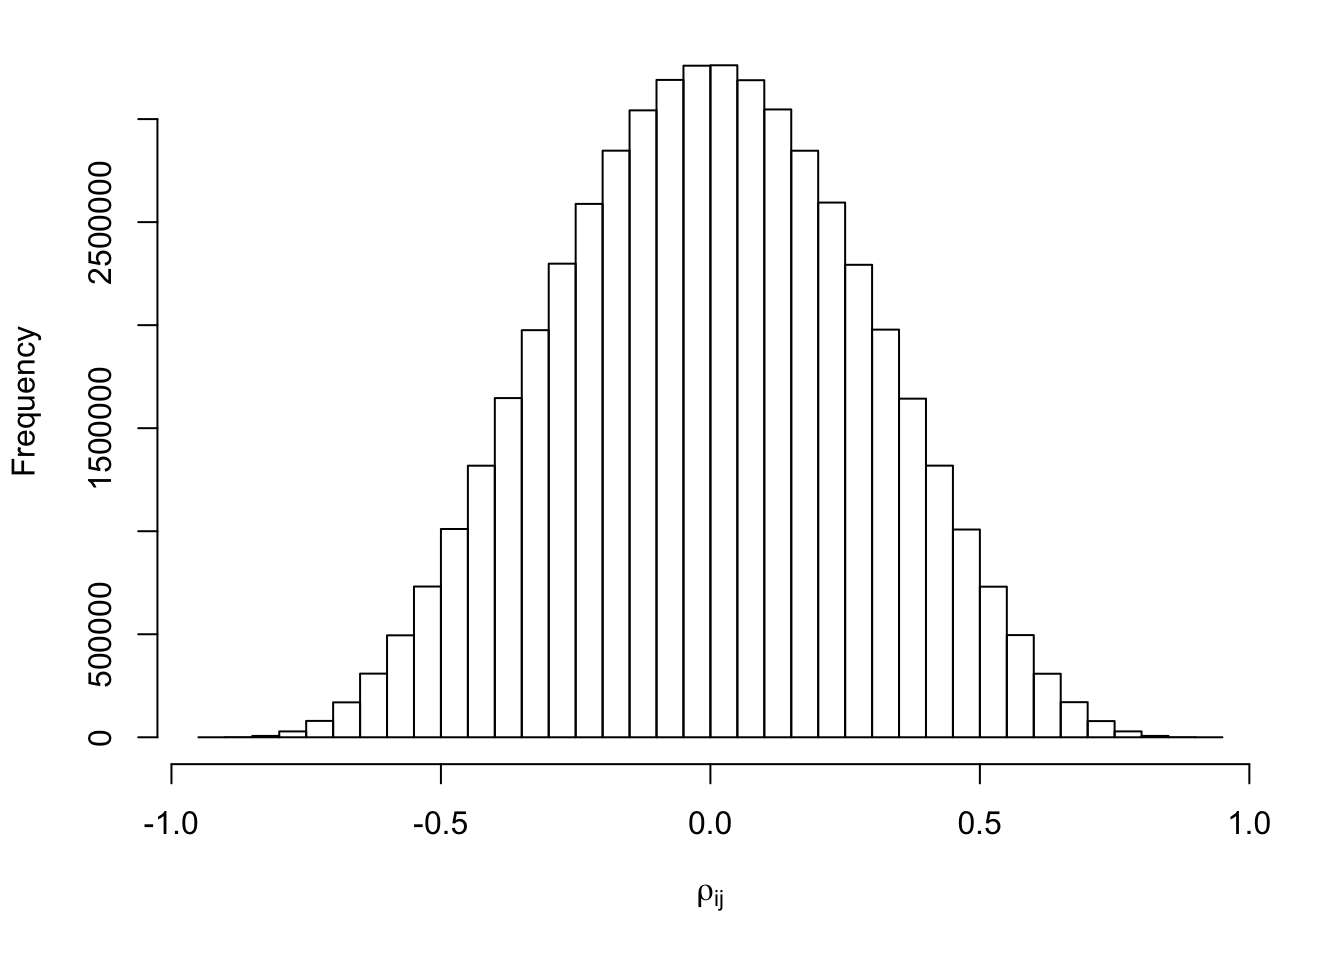
set.seed(20)
z <- rnorm(d)
Z <- B %*% z + rnorm(n)
Z <- Z / sqrt(sigma)
cat("sd(Z) =", sd(Z))
sd(Z) = 1.262205hist(Z, breaks = 20, prob = TRUE, ylim = c(0, dnorm(0)))
lines(seq(-5, 5, by = 0.1), dnorm(seq(-5, 5, by = 0.1)), col = "blue")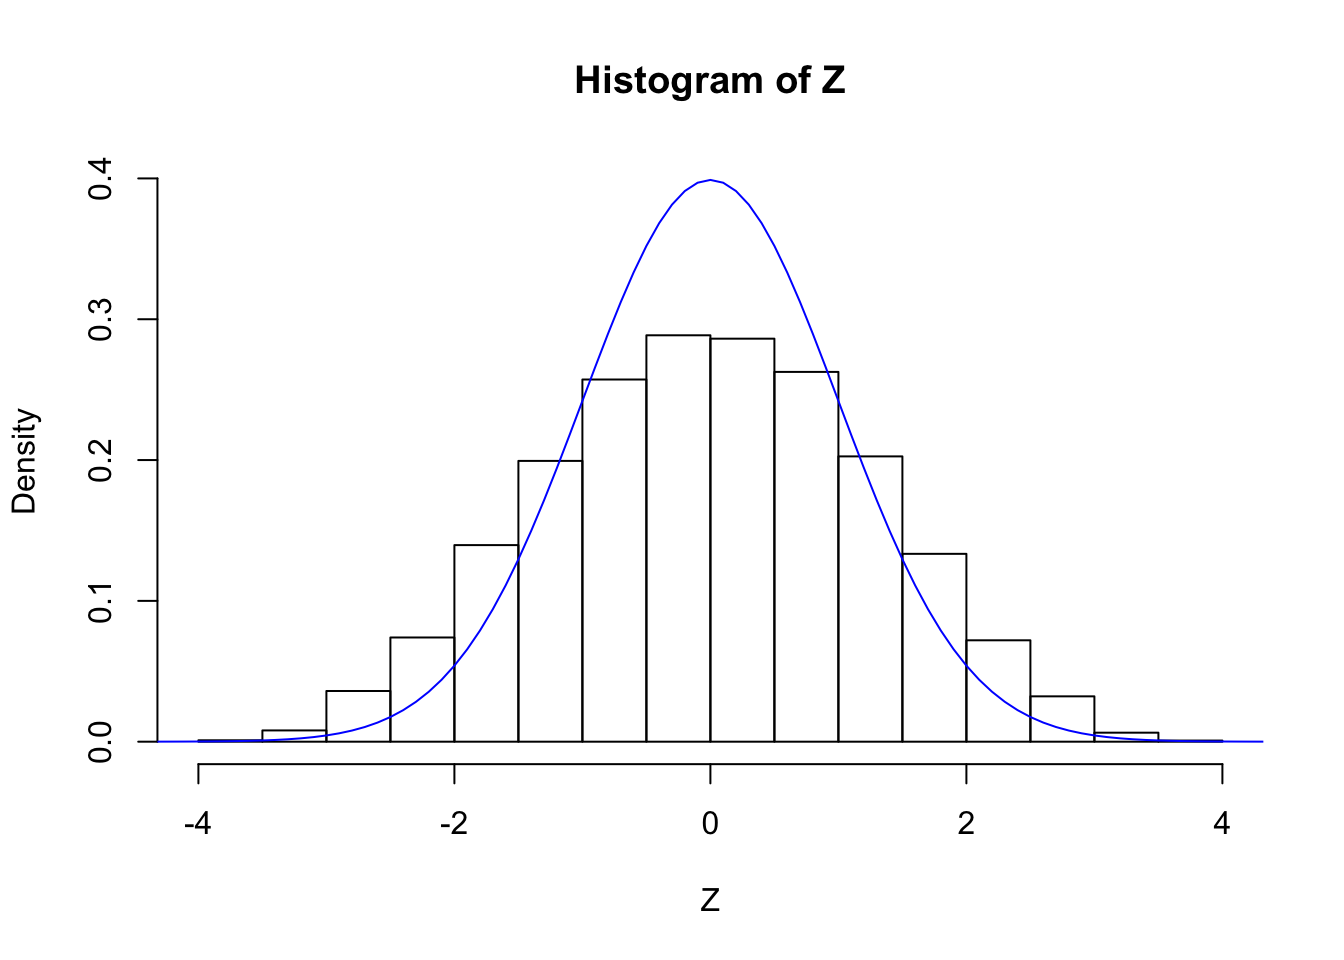
p <- pnorm(-abs(Z)) * 2

par(mfcol = c(2, 2))
par(mar = c(5.1, 4.1, 3, 2.1))
hist(p, breaks = 100, main = "Correlated", xlab = "p-value")

par(mar = c(5.1, 4.1, 1, 2.1))
plot(-log(p), ylim = range(-log(p), -log(pnorm(-sqrt(2 * log(n))) * 2), -log(0.05 / n)))
abline(h = -log(pnorm(-sqrt(2 * log(n))) * 2), col = "maroon")
abline(h = -log(0.05 / n), col = "red")
abline(h = -log(0.001), col = "green")
abline(h = -log(0.05), col = "blue")

Z <- rnorm(n)
p <- pnorm(-abs(Z)) * 2
par(mar = c(5.1, 4.1, 3, 2.1))
hist(p, breaks = 100, main = "Independent", xlab = "p-value")

par(mar = c(5.1, 4.1, 1, 2.1))
plot(-log(p), ylim = range(-log(p), -log(pnorm(-sqrt(2 * log(n))) * 2), -log(0.05 / n)))
abline(h = -log(pnorm(-sqrt(2 * log(n))) * 2), col = "maroon")
abline(h = -log(0.05 / n), col = "red")
abline(h = -log(0.001), col = "green")
abline(h = -log(0.05), col = "blue")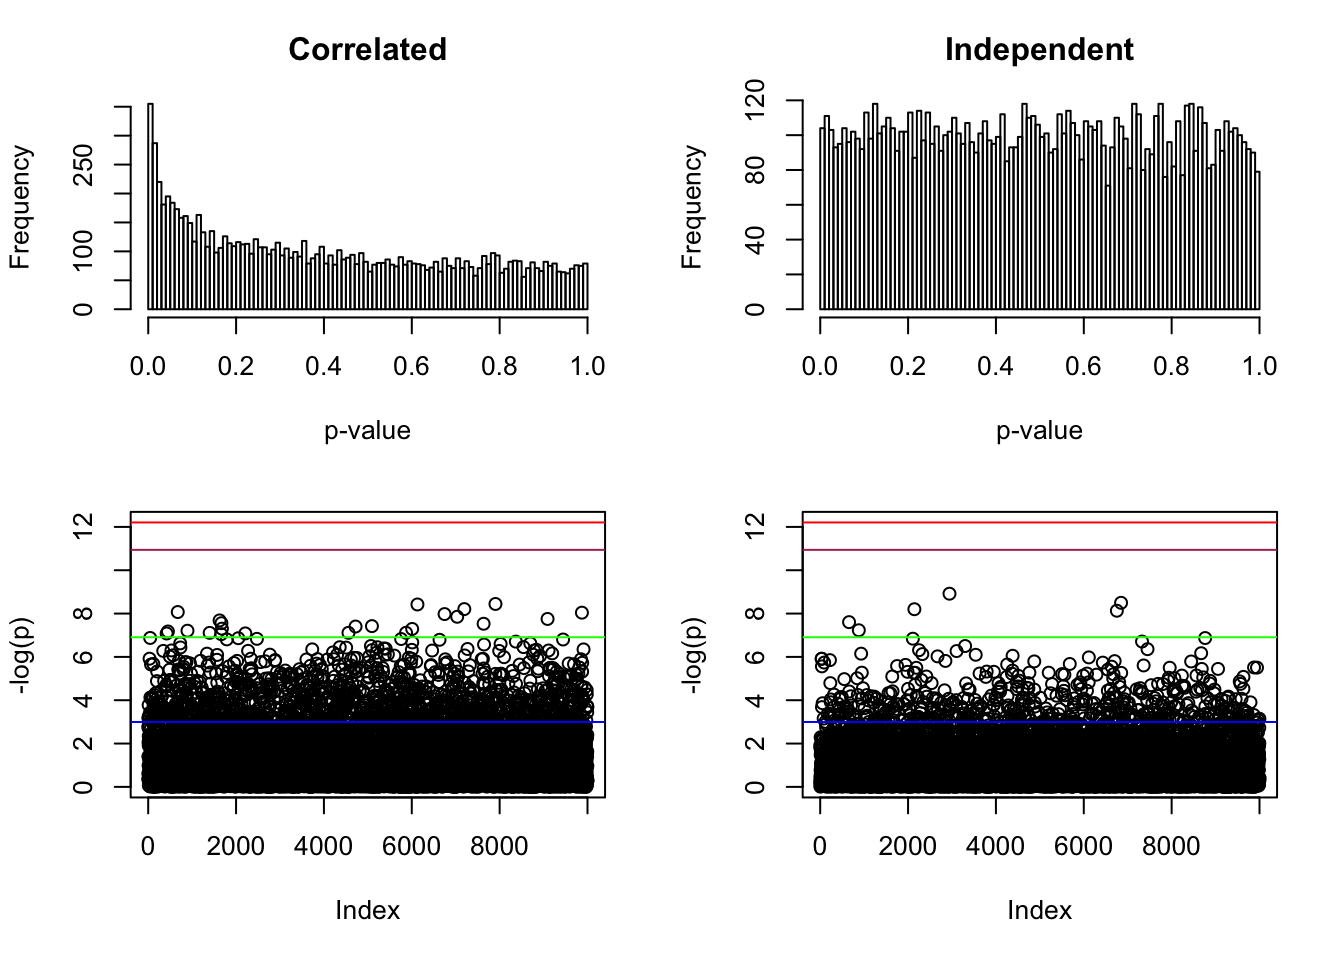
set.seed(777)
nsim <- 1e4
Z.list <- W <- list()
for (i in 1 : nsim) {
z <- rnorm(d)
Z <- B %*% z + rnorm(n)
Z <- Z / sqrt(sigma)
Z.list[[i]] <- Z
Z.GD <- gdfit.mom(Z, 100)
W[[i]] <- Z.GD$w
}
Z.sim <- Z.list
W.sim <- W
Real Data from GTEx
r <- readRDS("../data/liver.rds")top_genes_index = function (g, X) {
return(order(rowSums(X), decreasing = TRUE)[1 : g])
}
lcpm = function (r) {
R = colSums(r)
t(log2(((t(r) + 0.5) / (R + 1)) * 10^6))
}nsamp <- 5
ngene <- 1e4Y = lcpm(r)
subset = top_genes_index(ngene, Y)
r = r[subset,]set.seed(7)
nsim <- 1e4
Z.list <- W <- list()
for (i in 1 : nsim) {
## generate data
counts <- r[, sample(ncol(r), 2 * nsamp)]
design <- model.matrix(~c(rep(0, nsamp), rep(1, nsamp)))
summary <- count_to_summary(counts, design)
Z <- summary$z
Z.list[[i]] <- Z
Z.GD <- gdfit.mom(Z, 100)
W[[i]] <- Z.GD$w
}
Z.gtex <- Z.list
W.gtex <- Wquantile.vec1 <- exp(seq(-21, -5, by = 0.01))
quantile.vec2 <- seq(0.007, 0.993, by = 0.001)
quantile.vec3 <- exp(seq(-5, -21, by = -0.01))
emp.cdf.Z1 <- sapply(quantile.vec1, function(x) {sapply(Z.gtex, function(y) mean(y <= qnorm(x)))})
emp.cdf.Z2 <- sapply(quantile.vec2, function(x) {sapply(Z.gtex, function(y) mean(y <= qnorm(x)))})
emp.cdf.Z3 <- sapply(quantile.vec3, function(x) {sapply(Z.gtex, function(y) mean(y <= -qnorm(x)))})
emp.cdf.Z4 <- sapply(quantile.vec3, function(x) {sapply(Z.gtex, function(y) mean(y > -qnorm(x)))})ecdf.avg1 <- colMeans(emp.cdf.Z1)
ecdf.avg2 <- colMeans(emp.cdf.Z2)
ecdf.avg3 <- colMeans(emp.cdf.Z3)
ecdf.avg4 <- colMeans(emp.cdf.Z4)
ecdf.avg <- c(ecdf.avg1, ecdf.avg2, ecdf.avg3)
ecdf.tail.avg.conf.int1 <- apply(emp.cdf.Z1, 2, function(x) {t.test(x)$conf.int})
ecdf.tail.avg.conf.int4 <- apply(emp.cdf.Z4, 2, function(x) {t.test(x)$conf.int})plot(c(qnorm(quantile.vec1), qnorm(quantile.vec2), -qnorm(quantile.vec3)), ecdf.avg, type = "l", col = "red", xlab = "z", ylab = "Cumulative Distribution Function (CDF)")
lines(c(qnorm(quantile.vec1), qnorm(quantile.vec2), -qnorm(quantile.vec3)), c(quantile.vec1, quantile.vec2, pnorm(-qnorm(quantile.vec3))), lty = 2)
legend("bottomright", lty = c(1, 2), col = c(1, 2), legend = c(expression(bar("F")(z)), expression(Phi(z))))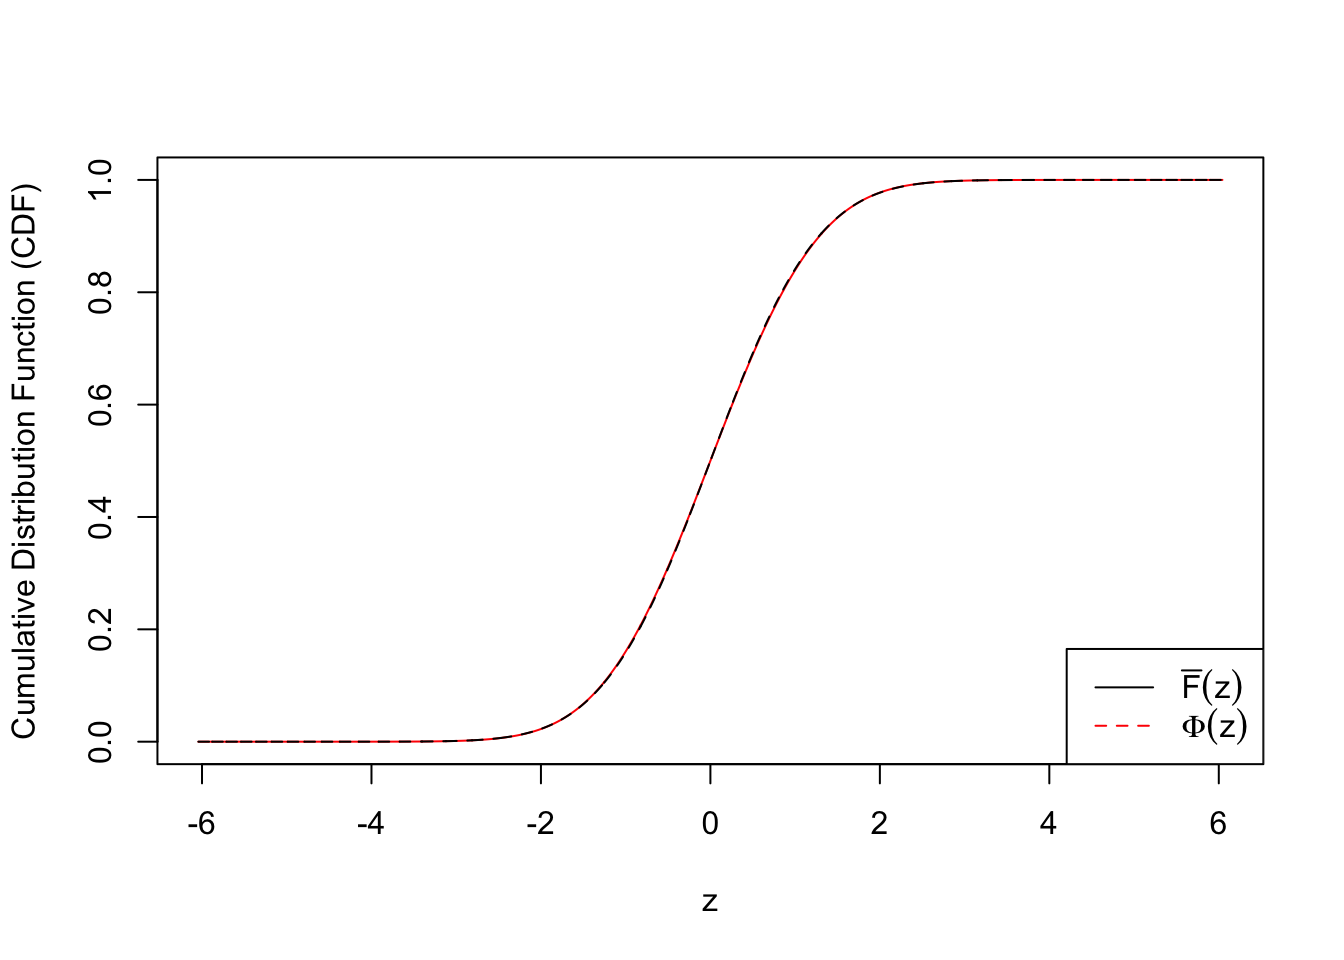
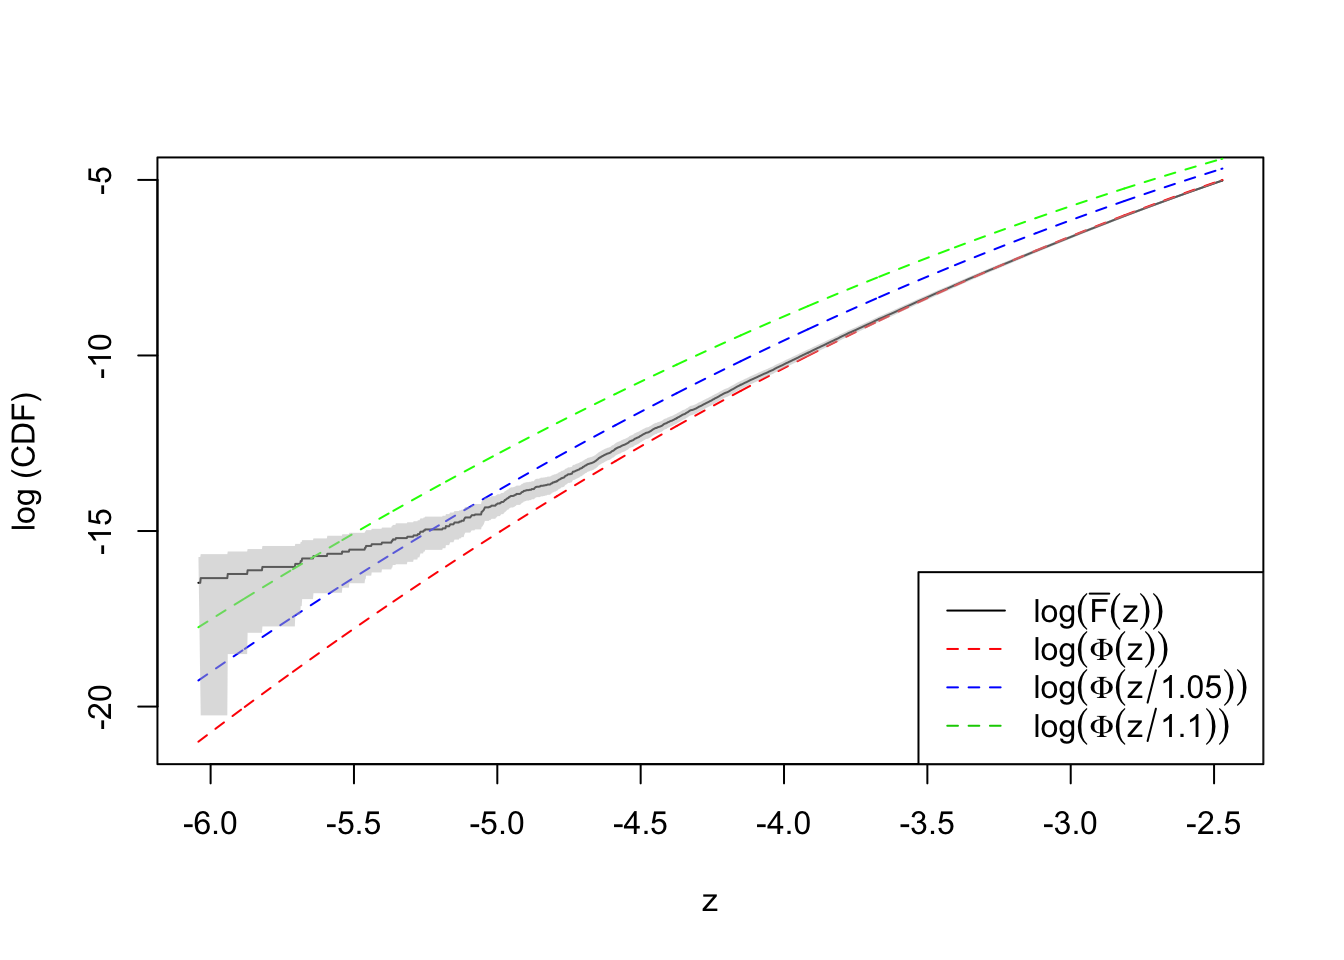
plot(qnorm(quantile.vec1), log(ecdf.avg1), type = "l",
     ylim = range(log(quantile.vec1), log(ecdf.avg1)),
     xlab = "z", ylab = "log (CDF)")
lines(qnorm(quantile.vec1), log(quantile.vec1), lty = 2, col = "red")
lines(qnorm(quantile.vec1), log(pnorm(qnorm(quantile.vec1), 0, 1.1)), lty = 2, col = "green")
lines(qnorm(quantile.vec1), log(pnorm(qnorm(quantile.vec1), 0, 1.05)), lty = 2, col = "blue")
polygon(x = c(qnorm(quantile.vec1), rev(qnorm(quantile.vec1))),
        y = c(log(ecdf.tail.avg.conf.int1[1, ]), rev(log(ecdf.tail.avg.conf.int1[2, ]))),
        border = NA,
        col = grDevices::adjustcolor("grey75", alpha.f = 0.5))
Warning in log(ecdf.tail.avg.conf.int1[1, ]): NaNs producedlegend("bottomright", lty = c(1, 2, 2, 2), col = c(1, 2, 4, 3), legend = c(
expression(log(bar("F")(z))),
expression(log(Phi(z))),
expression(log(Phi(z / 1.05))),
expression(log(Phi(z / 1.1)))
))
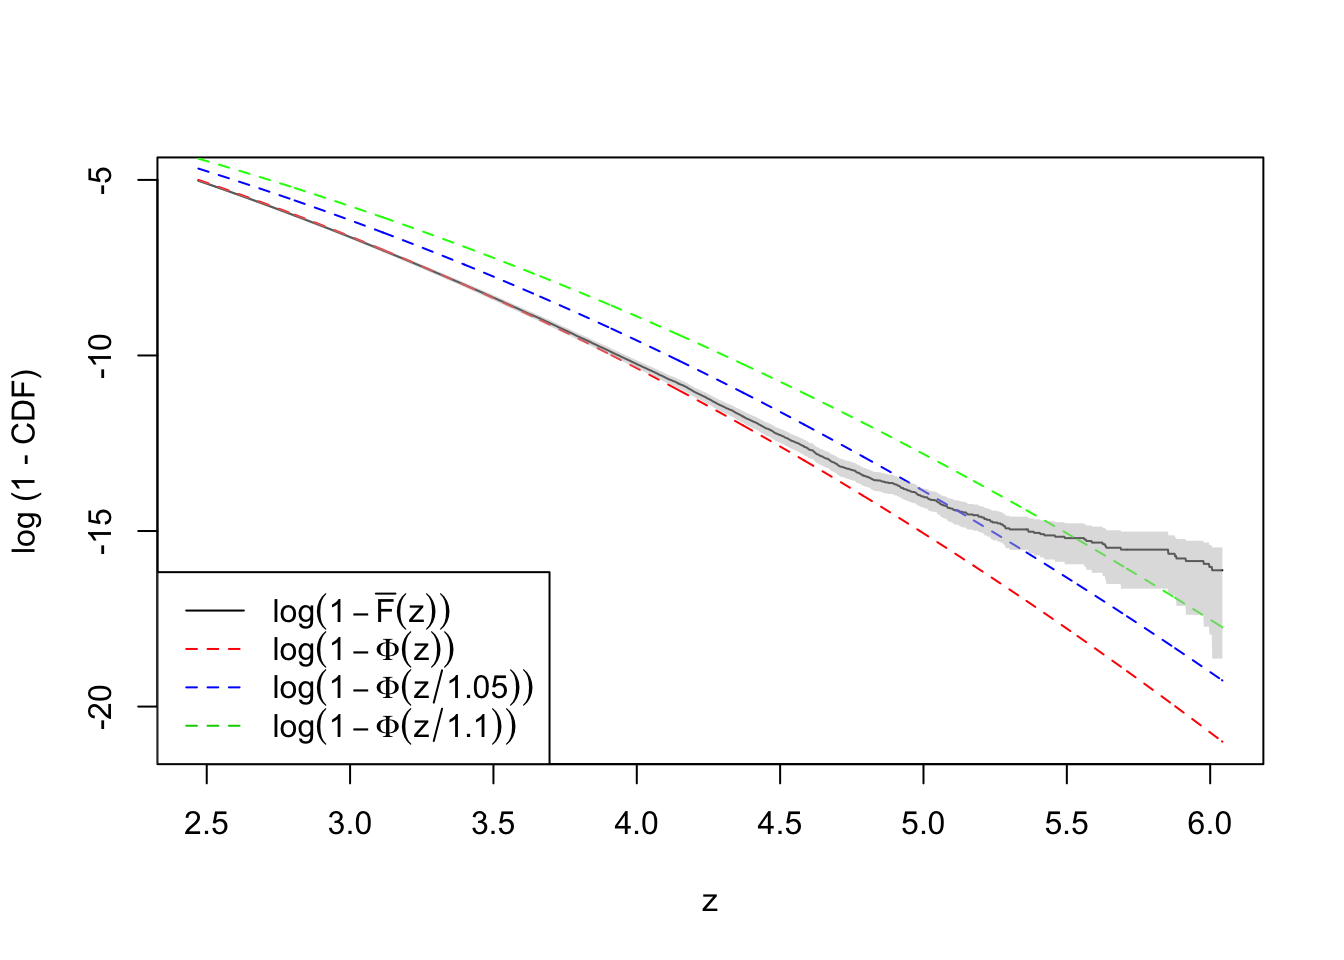
plot(-qnorm(quantile.vec3), log(ecdf.avg4), type = "l",
     ylim = range(log(quantile.vec3), log(ecdf.avg4)),
     xlab = "z", ylab = "log (1 - CDF)")
lines(-qnorm(quantile.vec3), log(quantile.vec3), lty = 2, col = "red")
lines(-qnorm(quantile.vec3), log(pnorm(qnorm(quantile.vec3), 0, 1.1)), lty = 2, col = "green")
lines(-qnorm(quantile.vec3), log(pnorm(qnorm(quantile.vec3), 0, 1.05)), lty = 2, col = "blue")
polygon(x = c(-qnorm(quantile.vec3), rev(-qnorm(quantile.vec3))),
        y = c(log(ecdf.tail.avg.conf.int4[1, ]), rev(log(ecdf.tail.avg.conf.int4[2, ]))),
        border = NA,
        col = grDevices::adjustcolor("grey75", alpha.f = 0.5))
legend("bottomleft", lty = c(1, 2, 2, 2), col = c(1, 2, 4, 3), legend = c(
  expression(log(1 - bar("F")(z))),
  expression(log(1 - Phi(z))),
  expression(log(1 - Phi(z / 1.05))),
  expression(log(1 - Phi(z / 1.1)))
))
set.seed(777)
nsamp <- 50
nsim <- 1e3
z <- sebetahat <- list()
for (i in 1 : nsim) {
  ## generate data
  counts <- r[, sample(ncol(r), 2 * nsamp)]
  design <- model.matrix(~c(rep(0, nsamp), rep(1, nsamp)))
  summary <- count_to_summary(counts, design)
  z[[i]] <- summary$z
  sebetahat[[i]] <- summary$sebetahat
}
sd.vec <- sapply(z, sd)
median.vec <- sapply(z, median)
fd.vec <- sapply(z, function(x) {
p <- pnorm(-abs(x)) * 2
sum(p <= 0.005)
})
sel <- c(834, 211, 397, 748)
par(mfrow = c(2, 2))
for (i in seq(sel)) {
fit <- gdfit(z[[sel[i]]], 10)
plot.gdfit(z[[sel[i]]], fit$w, fit$L, legend = FALSE)
}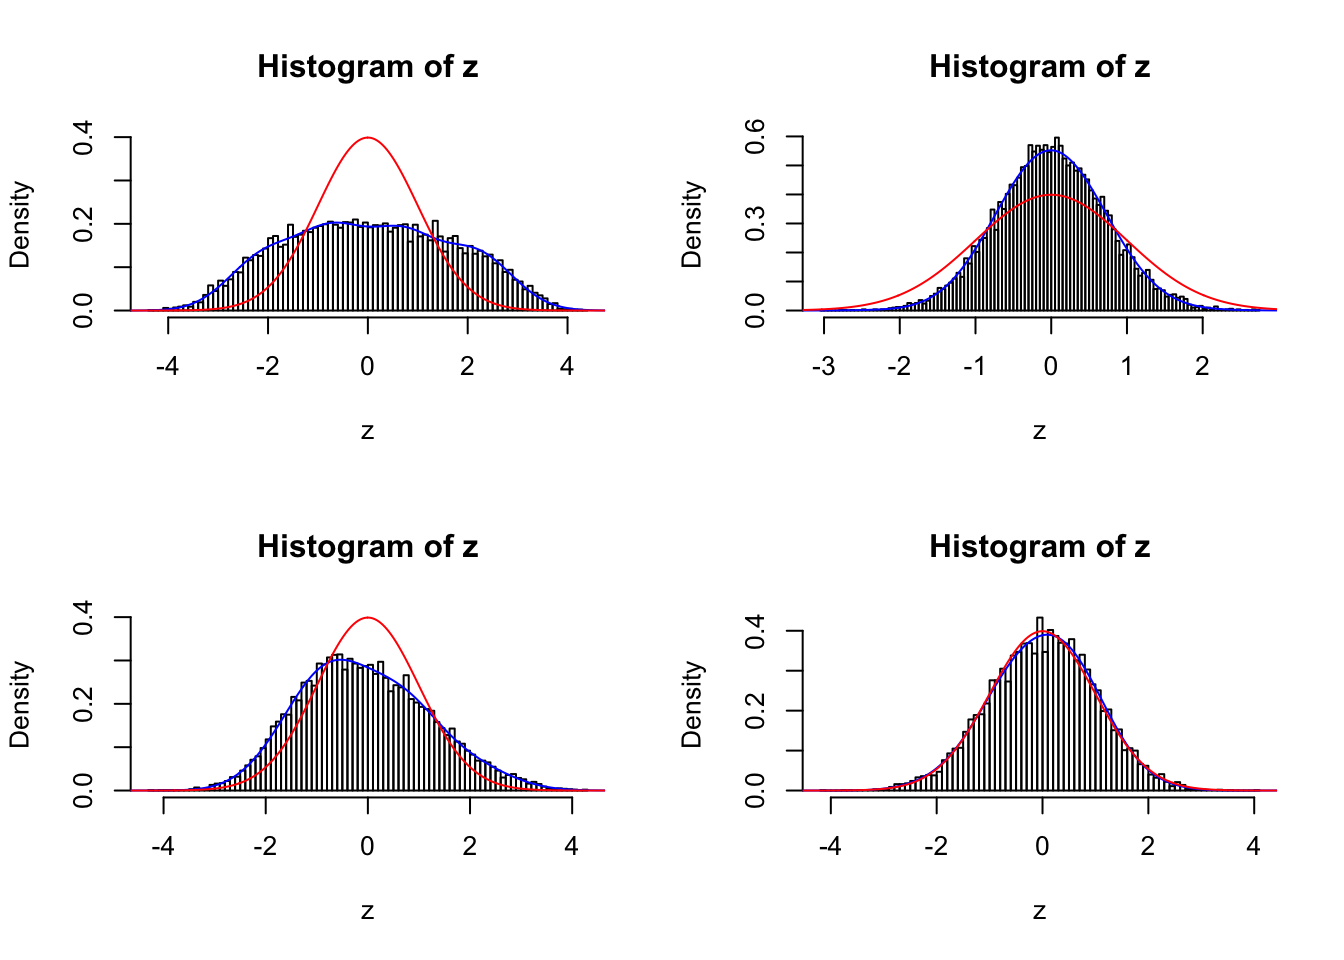
set.seed(6)
par(mfrow = c(2, 3))
par(mar = c(4.5, 4.5, 2, 2))
hist(pnorm(-abs(z[[834]])) * 2, prob = TRUE, xlab = "", breaks = 100, main = "(a): Histogram of two-sided p-values")
lines(c(0, 1), c(1, 1), col = "red")
hist(z[[834]], prob = TRUE, breaks = 100, xlab = "", xlim = c(-4.5, -2), main = "(b): Left tail of correlated z-scores")
lines(seq(-6, 6, by = 0.01), dnorm(seq(-6, 6, by = 0.01), 0, sd(z[[834]])), col = "blue")
lines(seq(-6, 6, by = 0.01), dnorm(seq(-6, 6, by = 0.01)), col = "red")
hist(z[[834]], prob = TRUE, breaks = 100, xlab = "", xlim = c(2, 4.5), main = "(c): Right tail of correlated z-scores")
lines(seq(-6, 6, by = 0.01), dnorm(seq(-6, 6, by = 0.01)), col = "red")
p <- pnorm(-abs(z[[834]])) * 2
plot(sample(-log(pnorm(-abs(z[[834]])) * 2)), ylim = c(0, 20), ylab = "-log(p)", main = expression(paste("(d): Correlated ", N(0, 1))))
abline(h = -log(0.005), col = "red")
abline(h = -log(pnorm(-sqrt(2 * log(1e4))) * 2), col = "blue")
abline(h = -log(0.05 / 1e4), col = "green")
plot(-log(pnorm(-abs(rnorm(1e4))) * 2), ylim = c(0, 20), ylab = "-log(p)", main = expression(paste("(e): Independent ", N(0, 1))))
abline(h = -log(0.005), col = "red")
abline(h = -log(pnorm(-sqrt(2 * log(1e4))) * 2), col = "blue")
abline(h = -log(0.05 / 1e4), col = "green")
plot(-log(pnorm(-abs(rnorm(1e4, 0, 1.6))) * 2), ylim = c(0, 20), ylab = "-log(p)", main = expression(paste("(f): Independent ", N(0, 1.6^2))))
abline(h = -log(0.005), col = "red")
abline(h = -log(pnorm(-sqrt(2 * log(1e4))) * 2), col = "blue")
abline(h = -log(0.05 / 1e4), col = "green")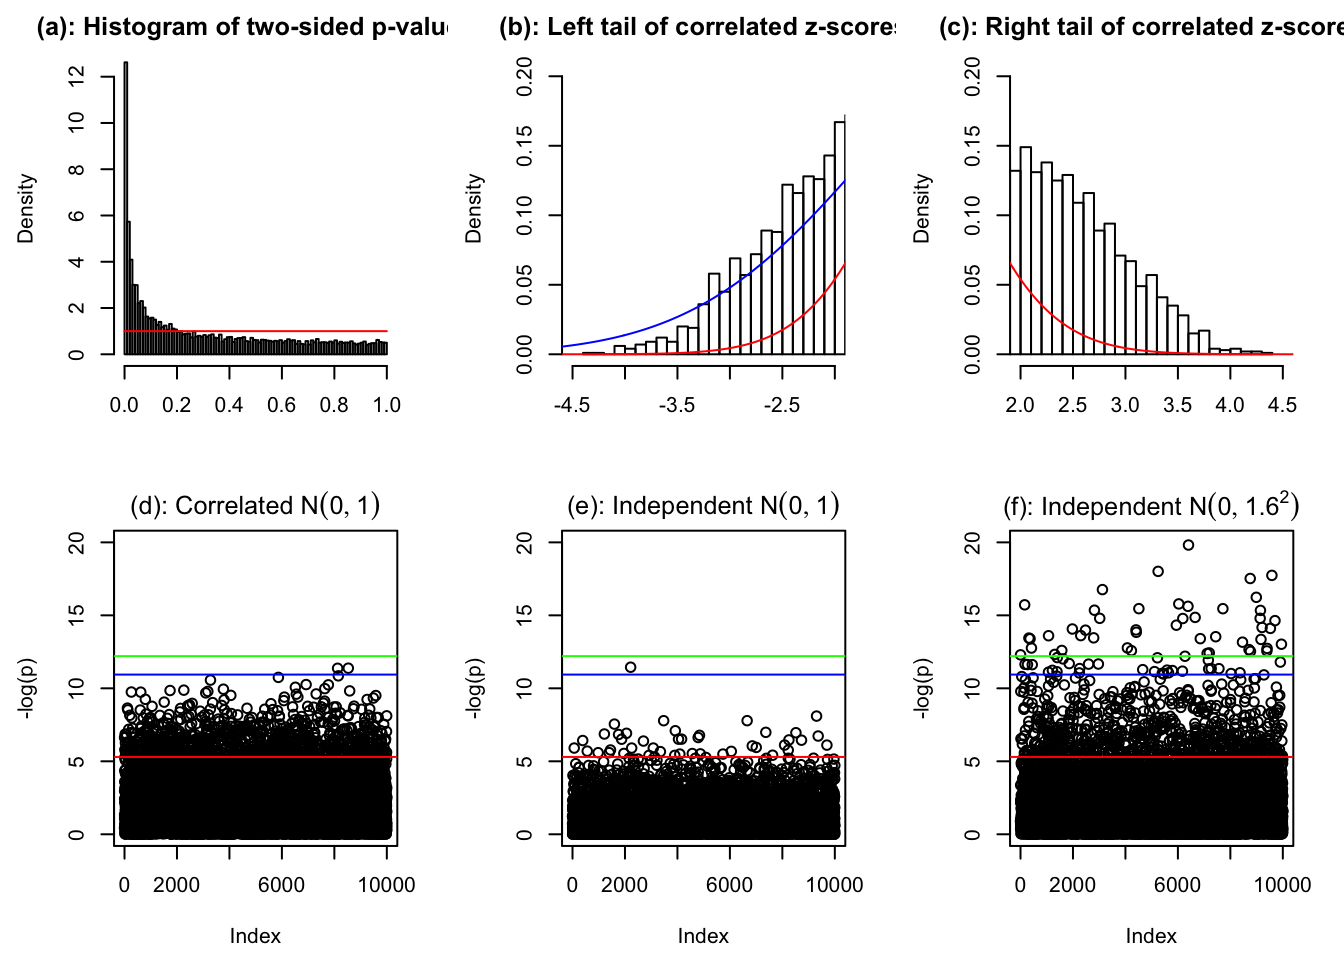
p.bh <- p.adjust(p, method = "BH")
sum(p.bh <= 0.05)
[1] 575plot(sort(log(p)), cex = 0.25, pch = 19, ylim = c(-19, 0), xlab = "Order", ylab = "log(p)")
set.seed(6)
z.indep <- rnorm(1e4)
points(sort(log(pnorm(-abs(z.indep)) * 2)), cex = 0.25, pch = 19, col = "blue")
z.indep <- rnorm(1e4, 0, 1.6)
points(sort(log(pnorm(-abs(z.indep)) * 2)), cex = 0.25, pch = 19, col = "green")
plot(sort(log(p)), cex = 0.25, pch = 19, ylim = c(-19, -2.5), xlim = c(1, 850), xlab = "Order", ylab = "log(p)")
set.seed(6)
z.indep <- rnorm(1e4)
points(sort(log(pnorm(-abs(z.indep)) * 2)), cex = 0.25, pch = 19, col = "blue")
z.indep <- rnorm(1e4, 0, 1.6)
points(sort(log(pnorm(-abs(z.indep)) * 2)), cex = 0.25, pch = 19, col = "green")
abline(h = log(0.005), col = "red", lty = 2)
abline(h = log(pnorm(-sqrt(2 * log(1e4))) * 2), col = "red", lty = 2)
abline(h = log(0.05 / 1e4), col = "red", lty = 2)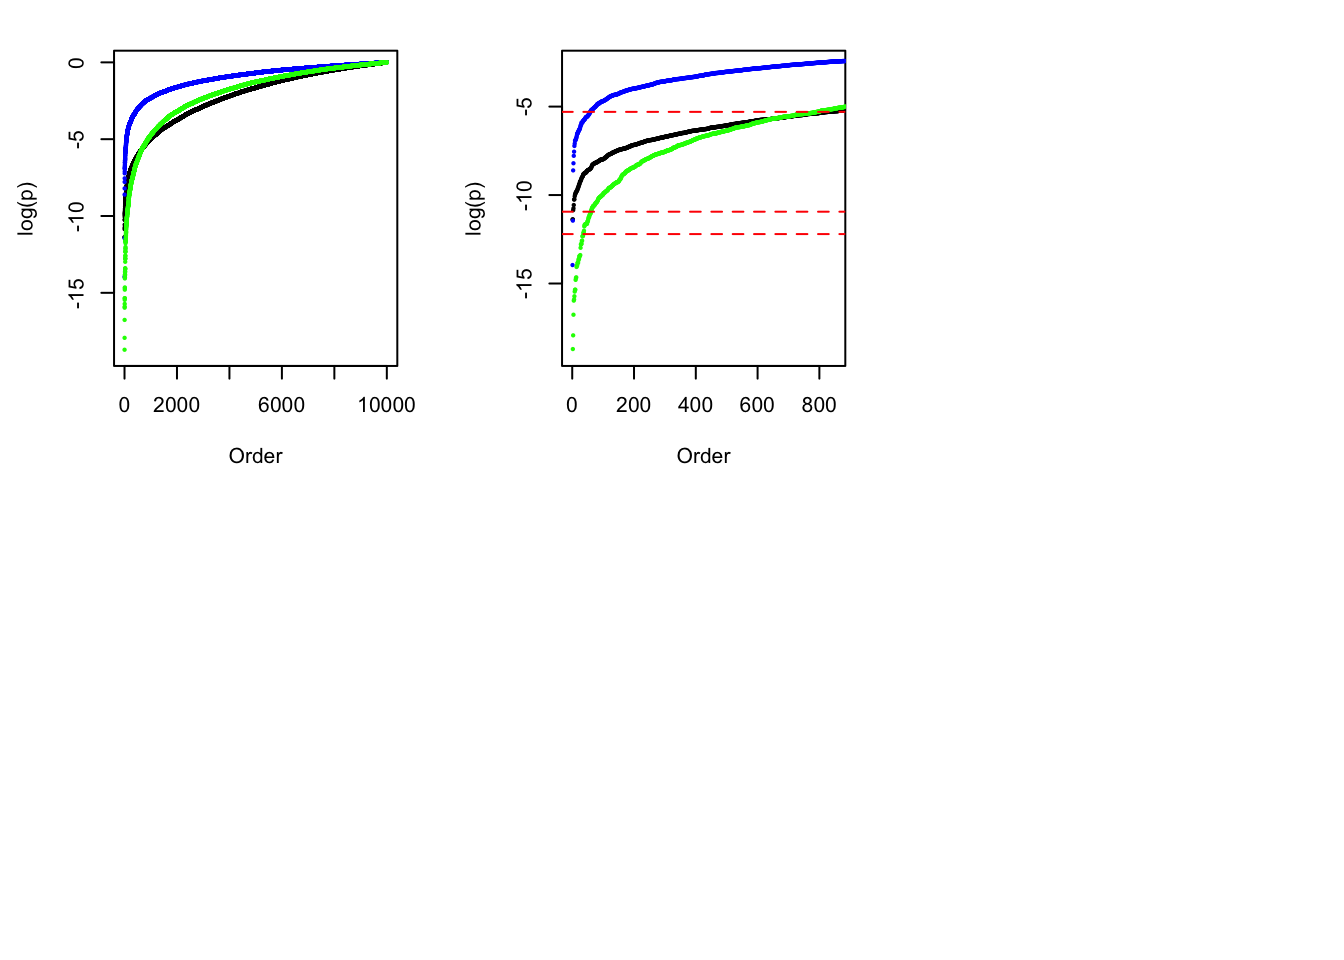
Session information
sessionInfo()R version 3.4.3 (2017-11-30)
Platform: x86_64-apple-darwin15.6.0 (64-bit)
Running under: macOS High Sierra 10.13.4
Matrix products: default
BLAS: /Library/Frameworks/R.framework/Versions/3.4/Resources/lib/libRblas.0.dylib
LAPACK: /Library/Frameworks/R.framework/Versions/3.4/Resources/lib/libRlapack.dylib
locale:
[1] en_US.UTF-8/en_US.UTF-8/en_US.UTF-8/C/en_US.UTF-8/en_US.UTF-8
attached base packages:
[1] stats graphics grDevices utils datasets methods base
other attached packages:
[1] reshape2_1.4.3 ggplot2_2.2.1 plyr_1.8.4
[4] edgeR_3.20.2 limma_3.34.4 ashr_2.2-2
[7] Rmosek_8.0.69 PolynomF_1.0-1 CVXR_0.95
[10] REBayes_1.2 Matrix_1.2-12 SQUAREM_2017.10-1
[13] EQL_1.0-0 ttutils_1.0-1
loaded via a namespace (and not attached):
[1] gmp_0.5-13.1 Rcpp_0.12.16 pillar_1.0.1
[4] compiler_3.4.3 git2r_0.21.0 R.methodsS3_1.7.1
[7] R.utils_2.6.0 iterators_1.0.9 tools_3.4.3
[10] digest_0.6.15 bit_1.1-12 tibble_1.4.1
[13] gtable_0.2.0 evaluate_0.10.1 lattice_0.20-35
[16] rlang_0.1.6 foreach_1.4.4 yaml_2.1.18
[19] parallel_3.4.3 Rmpfr_0.6-1 ECOSolveR_0.4
[22] stringr_1.3.0 knitr_1.20 locfit_1.5-9.1
[25] rprojroot_1.3-2 bit64_0.9-7 grid_3.4.3
[28] R6_2.2.2 rmarkdown_1.9 magrittr_1.5
[31] scales_0.5.0 MASS_7.3-47 backports_1.1.2
[34] codetools_0.2-15 htmltools_0.3.6 scs_1.1-1
[37] colorspace_1.3-2 stringi_1.1.6 lazyeval_0.2.1
[40] munsell_0.4.3 doParallel_1.0.11 pscl_1.5.2
[43] truncnorm_1.0-7 R.oo_1.21.0 This R Markdown site was created with workflowr