<!DOCTYPE html>

<html xmlns="http://www.w3.org/1999/xhtml">

<head>

<meta charset="utf-8" />
<meta http-equiv="Content-Type" content="text/html; charset=utf-8" />
<meta name="generator" content="pandoc" />


<meta name="author" content="Lei Sun" />

<meta name="date" content="2017-06-14" />

<title>Gaussian derivatives applied to Smemo’s data</title>

<script src="site_libs/jquery-1.11.3/jquery.min.js"></script>
<meta name="viewport" content="width=device-width, initial-scale=1" />
<link href="site_libs/bootstrap-3.3.5/css/cosmo.min.css" rel="stylesheet" />
<script src="site_libs/bootstrap-3.3.5/js/bootstrap.min.js"></script>
<script src="site_libs/bootstrap-3.3.5/shim/html5shiv.min.js"></script>
<script src="site_libs/bootstrap-3.3.5/shim/respond.min.js"></script>
<script src="site_libs/jqueryui-1.11.4/jquery-ui.min.js"></script>
<link href="site_libs/tocify-1.9.1/jquery.tocify.css" rel="stylesheet" />
<script src="site_libs/tocify-1.9.1/jquery.tocify.js"></script>
<script src="site_libs/navigation-1.1/tabsets.js"></script>
<link href="site_libs/highlightjs-1.1/textmate.css" rel="stylesheet" />
<script src="site_libs/highlightjs-1.1/highlight.js"></script>
<link href="site_libs/font-awesome-4.5.0/css/font-awesome.min.css" rel="stylesheet" />

<style type="text/css">code{white-space: pre;}</style>
<style type="text/css">
  pre:not([class]) {
    background-color: white;
  }
</style>
<script type="text/javascript">
if (window.hljs && document.readyState && document.readyState === "complete") {
   window.setTimeout(function() {
      hljs.initHighlighting();
   }, 0);
}
</script>


<style type="text/css">
h1 {
  font-size: 34px;
}
h1.title {
  font-size: 38px;
}
h2 {
  font-size: 30px;
}
h3 {
  font-size: 24px;
}
h4 {
  font-size: 18px;
}
h5 {
  font-size: 16px;
}
h6 {
  font-size: 12px;
}
.table th:not([align]) {
  text-align: left;
}
</style>


</head>

<body>

<style type = "text/css">
.main-container {
  max-width: 940px;
  margin-left: auto;
  margin-right: auto;
}
code {
  color: inherit;
  background-color: rgba(0, 0, 0, 0.04);
}
img {
  max-width:100%;
  height: auto;
}
.tabbed-pane {
  padding-top: 12px;
}
button.code-folding-btn:focus {
  outline: none;
}
</style>


<style type="text/css">
/* padding for bootstrap navbar */
body {
  padding-top: 51px;
  padding-bottom: 40px;
}
/* offset scroll position for anchor links (for fixed navbar)  */
.section h1 {
  padding-top: 56px;
  margin-top: -56px;
}

.section h2 {
  padding-top: 56px;
  margin-top: -56px;
}
.section h3 {
  padding-top: 56px;
  margin-top: -56px;
}
.section h4 {
  padding-top: 56px;
  margin-top: -56px;
}
.section h5 {
  padding-top: 56px;
  margin-top: -56px;
}
.section h6 {
  padding-top: 56px;
  margin-top: -56px;
}
</style>

<script>
// manage active state of menu based on current page
$(document).ready(function () {
  // active menu anchor
  href = window.location.pathname
  href = href.substr(href.lastIndexOf('/') + 1)
  if (href === "")
    href = "index.html";
  var menuAnchor = $('a[href="' + href + '"]');

  // mark it active
  menuAnchor.parent().addClass('active');

  // if it's got a parent navbar menu mark it active as well
  menuAnchor.closest('li.dropdown').addClass('active');
});
</script>


<div class="container-fluid main-container">

<!-- tabsets -->
<script>
$(document).ready(function () {
  window.buildTabsets("TOC");
});
</script>

<!-- code folding -->


<script>
$(document).ready(function ()  {

    // move toc-ignore selectors from section div to header
    $('div.section.toc-ignore')
        .removeClass('toc-ignore')
        .children('h1,h2,h3,h4,h5').addClass('toc-ignore');

    // establish options
    var options = {
      selectors: "h1,h2,h3",
      theme: "bootstrap3",
      context: '.toc-content',
      hashGenerator: function (text) {
        return text.replace(/[.\\/?&!#<>]/g, '').replace(/\s/g, '_').toLowerCase();
      },
      ignoreSelector: ".toc-ignore",
      scrollTo: 0
    };
    options.showAndHide = true;
    options.smoothScroll = true;

    // tocify
    var toc = $("#TOC").tocify(options).data("toc-tocify");
});
</script>

<style type="text/css">

#TOC {
  margin: 25px 0px 20px 0px;
}
@media (max-width: 768px) {
#TOC {
  position: relative;
  width: 100%;
}
}


.toc-content {
  padding-left: 30px;
  padding-right: 40px;
}

div.main-container {
  max-width: 1200px;
}

div.tocify {
  width: 20%;
  max-width: 260px;
  max-height: 85%;
}

@media (min-width: 768px) and (max-width: 991px) {
  div.tocify {
    width: 25%;
  }
}

@media (max-width: 767px) {
  div.tocify {
    width: 100%;
    max-width: none;
  }
}

.tocify ul, .tocify li {
  line-height: 20px;
}

.tocify-subheader .tocify-item {
  font-size: 0.90em;
  padding-left: 25px;
  text-indent: 0;
}

.tocify .list-group-item {
  border-radius: 0px;
}


</style>

<!-- setup 3col/9col grid for toc_float and main content  -->
<div class="row-fluid">
<div class="col-xs-12 col-sm-4 col-md-3">
<div id="TOC" class="tocify">
</div>
</div>

<div class="toc-content col-xs-12 col-sm-8 col-md-9">


<div class="navbar navbar-default  navbar-fixed-top" role="navigation">
  <div class="container">
    <div class="navbar-header">
      <button type="button" class="navbar-toggle collapsed" data-toggle="collapse" data-target="#navbar">
        <span class="icon-bar"></span>
        <span class="icon-bar"></span>
        <span class="icon-bar"></span>
      </button>
      <a class="navbar-brand" href="index.html">truncash</a>
    </div>
    <div id="navbar" class="navbar-collapse collapse">
      <ul class="nav navbar-nav">
        <li>
  <a href="index.html">Home</a>
</li>
<li>
  <a href="about.html">About</a>
</li>
<li>
  <a href="license.html">License</a>
</li>
      </ul>
      <ul class="nav navbar-nav navbar-right">
        <li>
  <a href="https://github.com/LSun/truncash">
    <span class="fa fa-github"></span>
     
  </a>
</li>
      </ul>
    </div><!--/.nav-collapse -->
  </div><!--/.container -->
</div><!--/.navbar -->

<div class="fluid-row" id="header">


<h1 class="title toc-ignore">Gaussian derivatives applied to Smemo’s data</h1>
<h4 class="author"><em>Lei Sun</em></h4>
<h4 class="date"><em>2017-06-14</em></h4>

</div>


<!-- The file analysis/chunks.R contains chunks that define default settings
shared across the workflowr files. -->
<!-- Update knitr chunk options -->
<!-- Insert the date the file was last updated -->
<p><strong>Last updated:</strong> 2017-11-07</p>
<!-- Insert the code version (Git commit SHA1) if Git repository exists and R
 package git2r is installed -->
<p><strong>Code version:</strong> 2c05d59</p>
<!-- Add your analysis here -->
<div id="introduction" class="section level2">
<h2>Introduction</h2>
<p><a href="http://www.nature.com/nature/journal/v507/n7492/abs/nature13138.html">Smemo et al 2014</a> provides a mouse heart RNA-seq data set. The data set contains 2 conditions, and each condition has only 2 samples. We’ll see if Gaussian derivatives can handle this difficult situation.</p>
<pre class="r"><code>counts = read.table(&quot;../data/smemo.txt&quot;, header = T, row.name = 1)
counts = counts[, -5]</code></pre>
<pre class="r"><code>## Number of genes
nrow(counts)</code></pre>
<pre><code>[1] 23587</code></pre>
<pre class="r"><code>## Number of samples
ncol(counts)</code></pre>
<pre><code>[1] 4</code></pre>
<pre class="r"><code>## Sneak peek
head(counts, 10)</code></pre>
<pre><code>          lv1  lv2   rv1   rv2
Itm2a    2236 2174  9484 10883
Sergef     97   90   341   408
Fam109a   383  314  1864  2384
Dhx9     2688 2631 18501 20879
Ssu72     762  674  2806  3435
Olfr1018    0    0     0     0
Fam71e2     0    0     0     0
Eif2b2    736  762  3081  3601
Mks1       77   82   398   685
Hebp2     203  205   732   921</code></pre>
</div>
<div id="preprocessing" class="section level2">
<h2>Preprocessing</h2>
<p>In the first exploratory investigation, we only choose genes whose expression levels are not all zero for all 4 samples. This is to prevent the complications brought by “non-expressed” genes.</p>
<pre class="r"><code>counts.nonzero = counts[rowSums(counts) &gt;= 1, ]
## Equivalently
## counts.nonzero = counts[apply(counts, 1, max) &gt;= 1, ]
design = model.matrix(~c(0, 0, 1, 1))
## Number of genes expressed
nrow(counts.nonzero)</code></pre>
<pre><code>[1] 18615</code></pre>
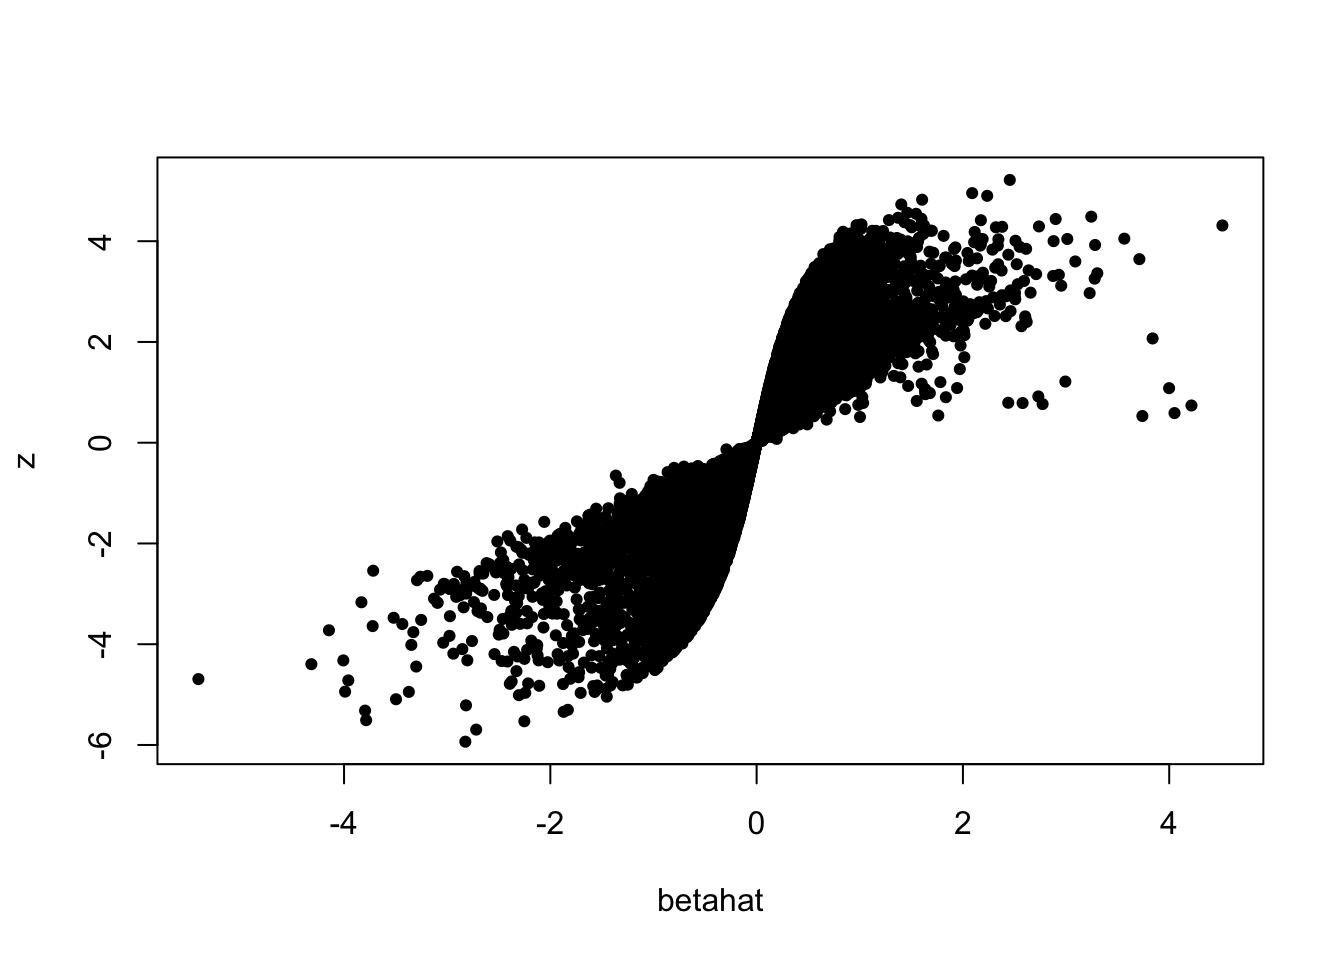
<p>Then we feed the count matrix to <a href="nullpipeline.html">the pipeline to get the summary statistics</a>: <span class="math inline">\(\hat\beta\)</span>, <span class="math inline">\(\hat s\)</span>, <span class="math inline">\(z\)</span>.</p>
<pre class="r"><code>counts_to_summary = function (counts, design) {
  dgecounts = edgeR::calcNormFactors(edgeR::DGEList(counts = counts, group = design[, 2]))
  v = limma::voom(dgecounts, design, plot = FALSE)
  lim = limma::lmFit(v)
  r.ebayes = limma::eBayes(lim)
  p = r.ebayes$p.value[, 2]
  t = r.ebayes$t[, 2]
  z = sign(t) * qnorm(1 - p/2)
  betahat = lim$coefficients[,2]
  sebetahat = betahat / z
  return (list(betahat = betahat, sebetahat = sebetahat, z = z))
}</code></pre>
</div>
<div id="fitting-z-with-gaussian-derivatives" class="section level2">
<h2>Fitting <span class="math inline">\(z\)</span> with Gaussian derivatives</h2>
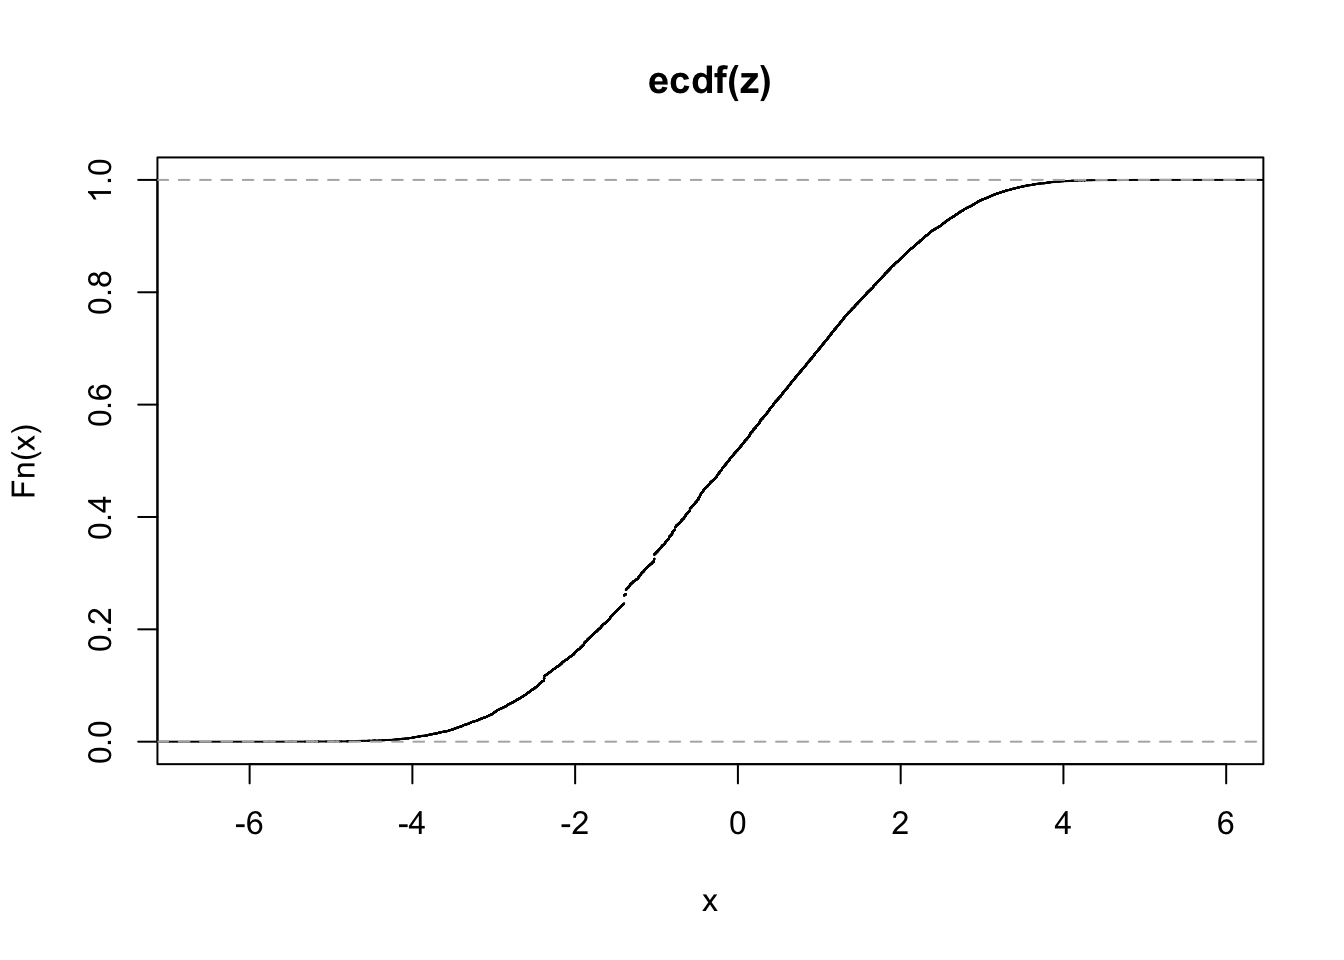
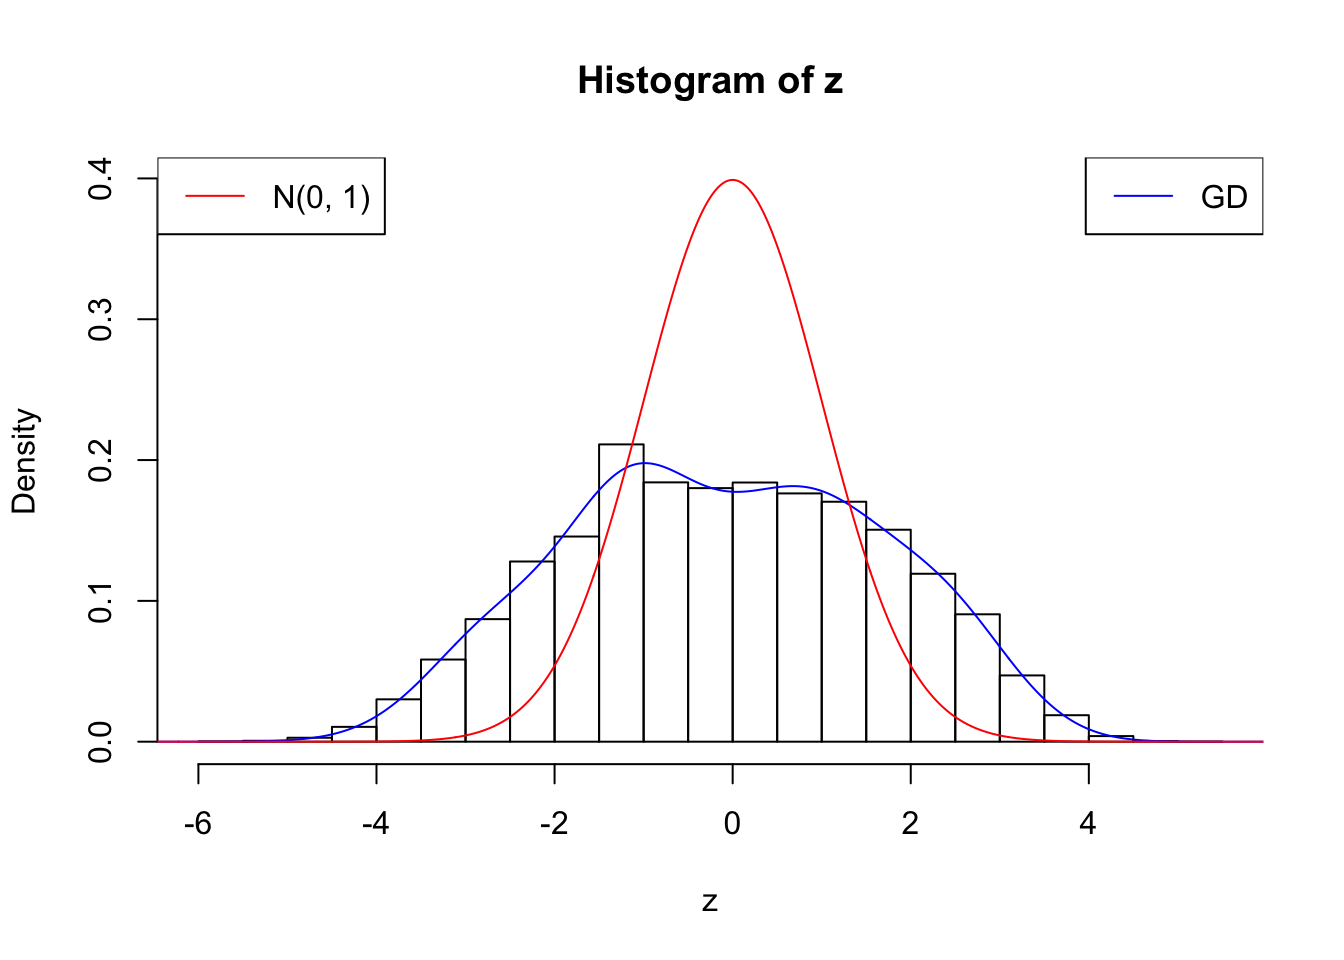
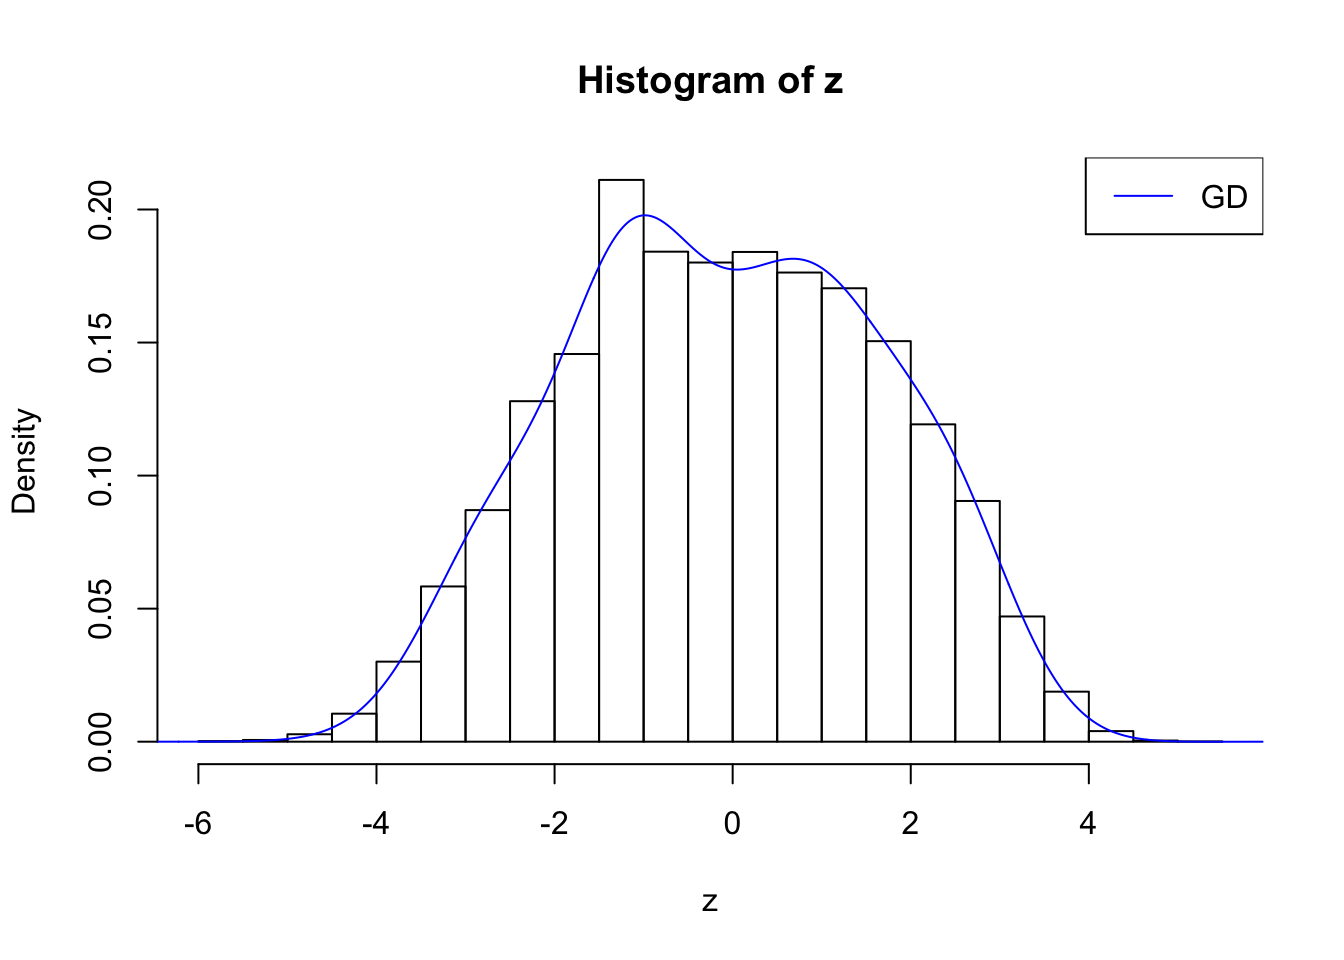
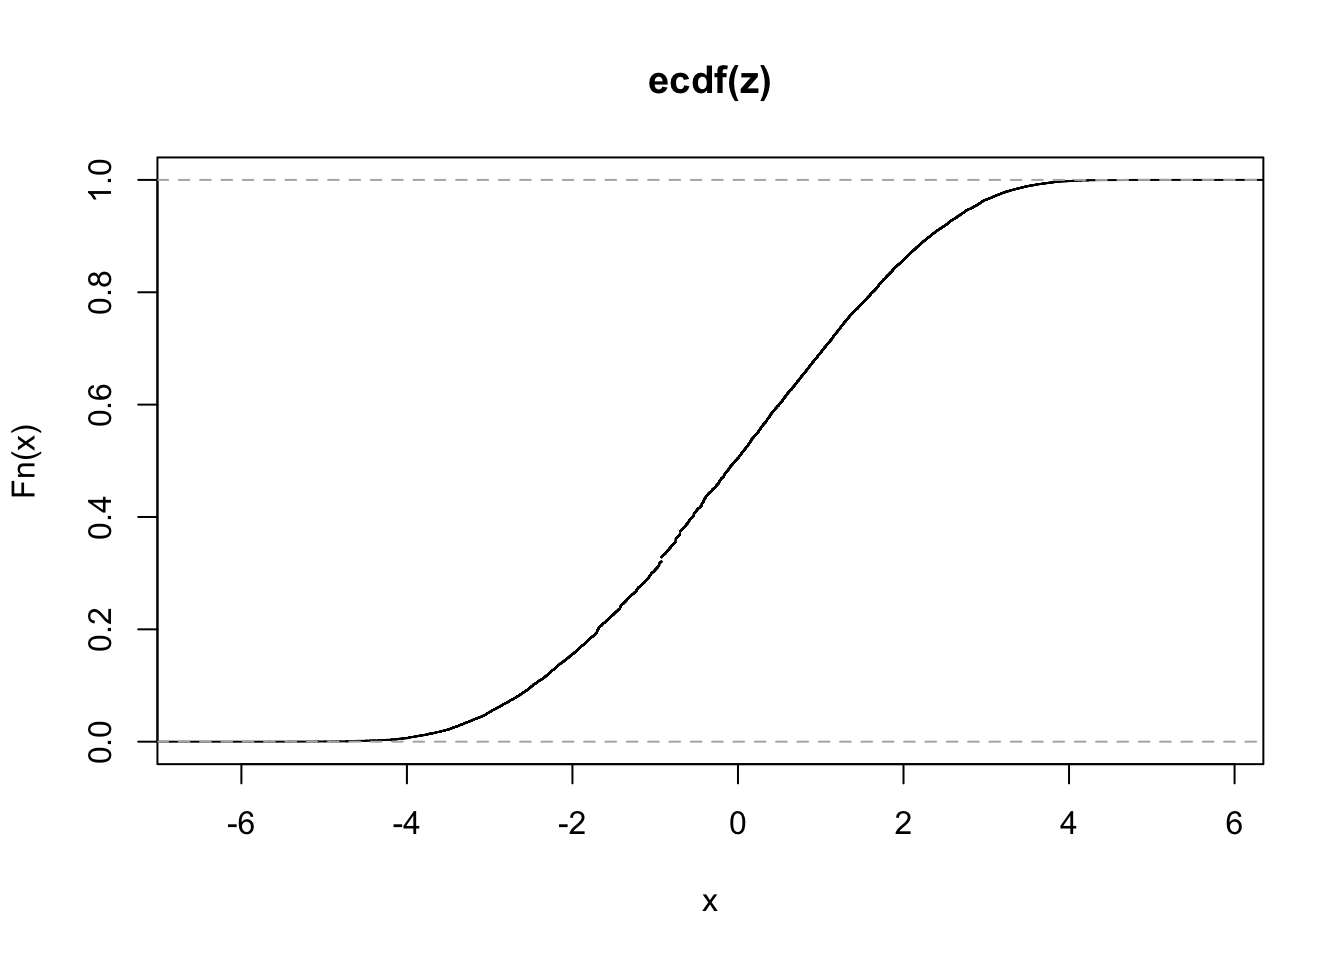
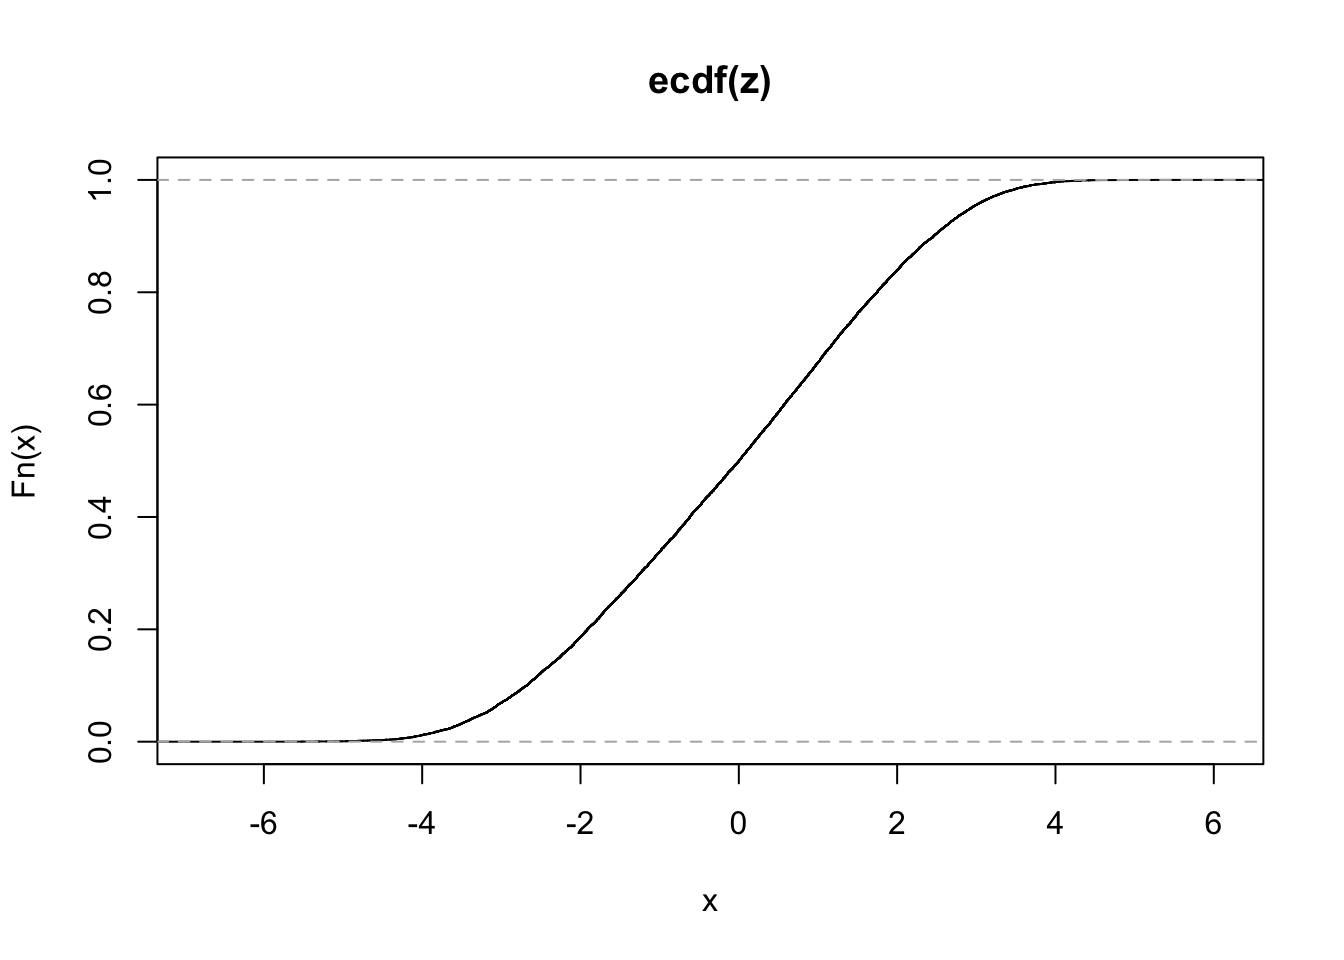
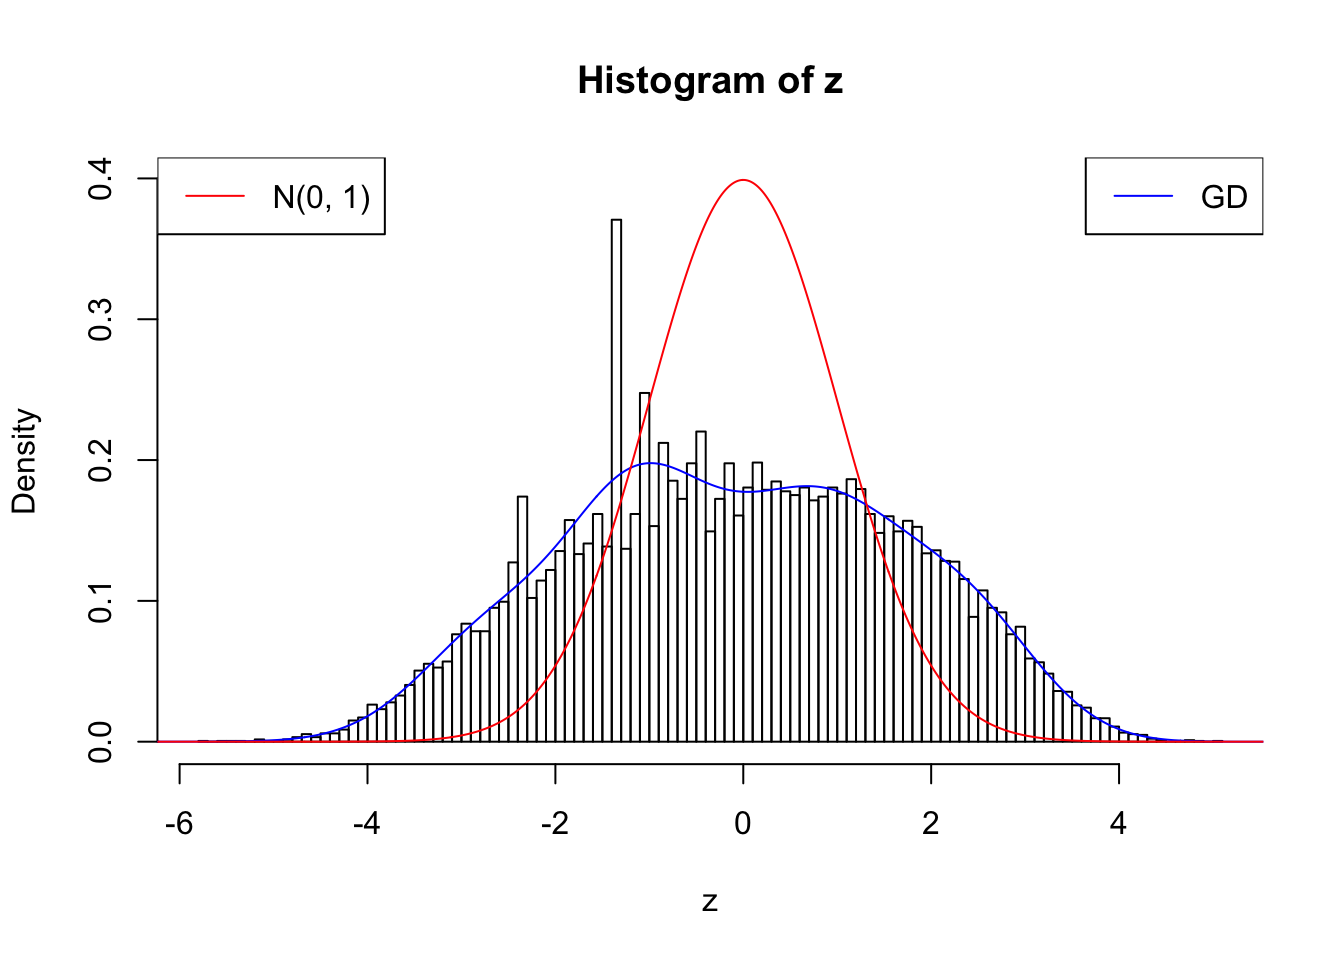
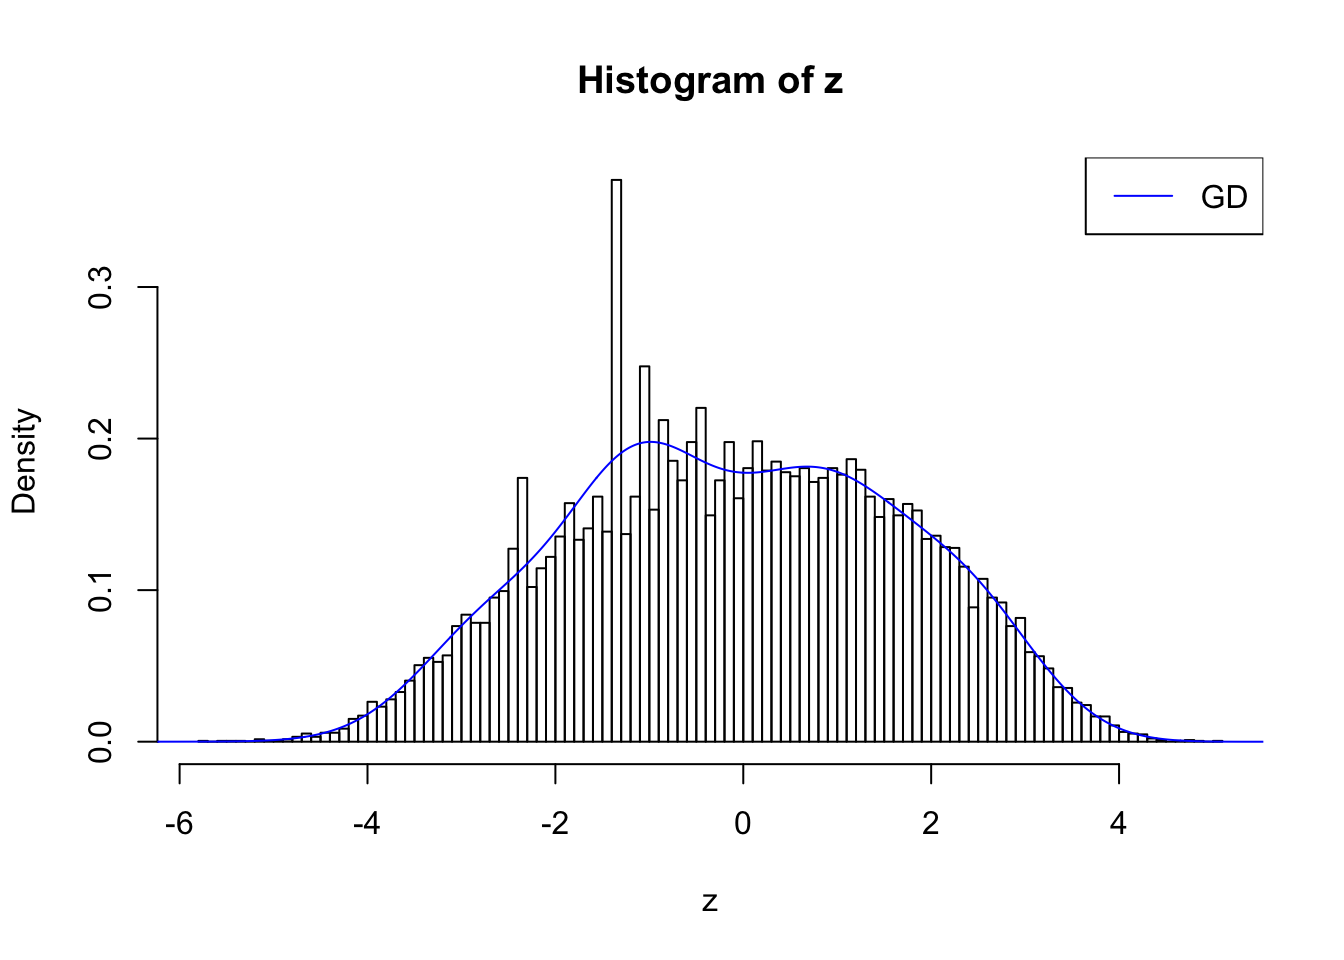
<p>Suppose <span class="math inline">\(z\)</span> are correlated null, will they be well fitted by 10 Gaussian derivatives?</p>
<pre class="r"><code>source(&quot;../code/gdash.R&quot;)</code></pre>
<pre><code>Warning: replacing previous import &#39;Matrix::crossprod&#39; by &#39;gmp::crossprod&#39;
when loading &#39;cvxr&#39;</code></pre>
<pre><code>Warning: replacing previous import &#39;Matrix::tcrossprod&#39; by
&#39;gmp::tcrossprod&#39; when loading &#39;cvxr&#39;</code></pre>
<pre class="r"><code>source(&quot;../code/gdfit.R&quot;)
w.fit = gdfit(z, gd.ord = 10)
plot.gdfit(z, w.fit$w, w.fit$gd.ord, breaks = 100)</code></pre>
<p><img src="figure/smemo.rmd/nonzero%20fitting%20and%20plotting-1.png" width="672" style="display: block; margin: auto;" /></p>
<pre class="r"><code>plot.gdfit(z, w.fit$w, w.fit$gd.ord, std.norm = FALSE, breaks = 100)</code></pre>
<p><img src="figure/smemo.rmd/nonzero%20fitting%20and%20plotting-2.png" width="672" style="display: block; margin: auto;" /></p>
<pre class="r"><code>plot(ecdf(z))</code></pre>
<p><img src="figure/smemo.rmd/nonzero%20fitting%20and%20plotting-3.png" width="672" style="display: block; margin: auto;" /></p>
<pre class="r"><code>plot.gdfit(z, w.fit$w, w.fit$gd.ord, breaks = &quot;Sturges&quot;)</code></pre>
<p><img src="figure/smemo.rmd/nonzero%20fitting%20and%20plotting-4.png" width="672" style="display: block; margin: auto;" /></p>
<pre class="r"><code>plot.gdfit(z, w.fit$w, w.fit$gd.ord, std.norm = FALSE, breaks = &quot;Sturges&quot;)</code></pre>
<p><img src="figure/smemo.rmd/nonzero%20fitting%20and%20plotting-5.png" width="672" style="display: block; margin: auto;" /></p>
</div>
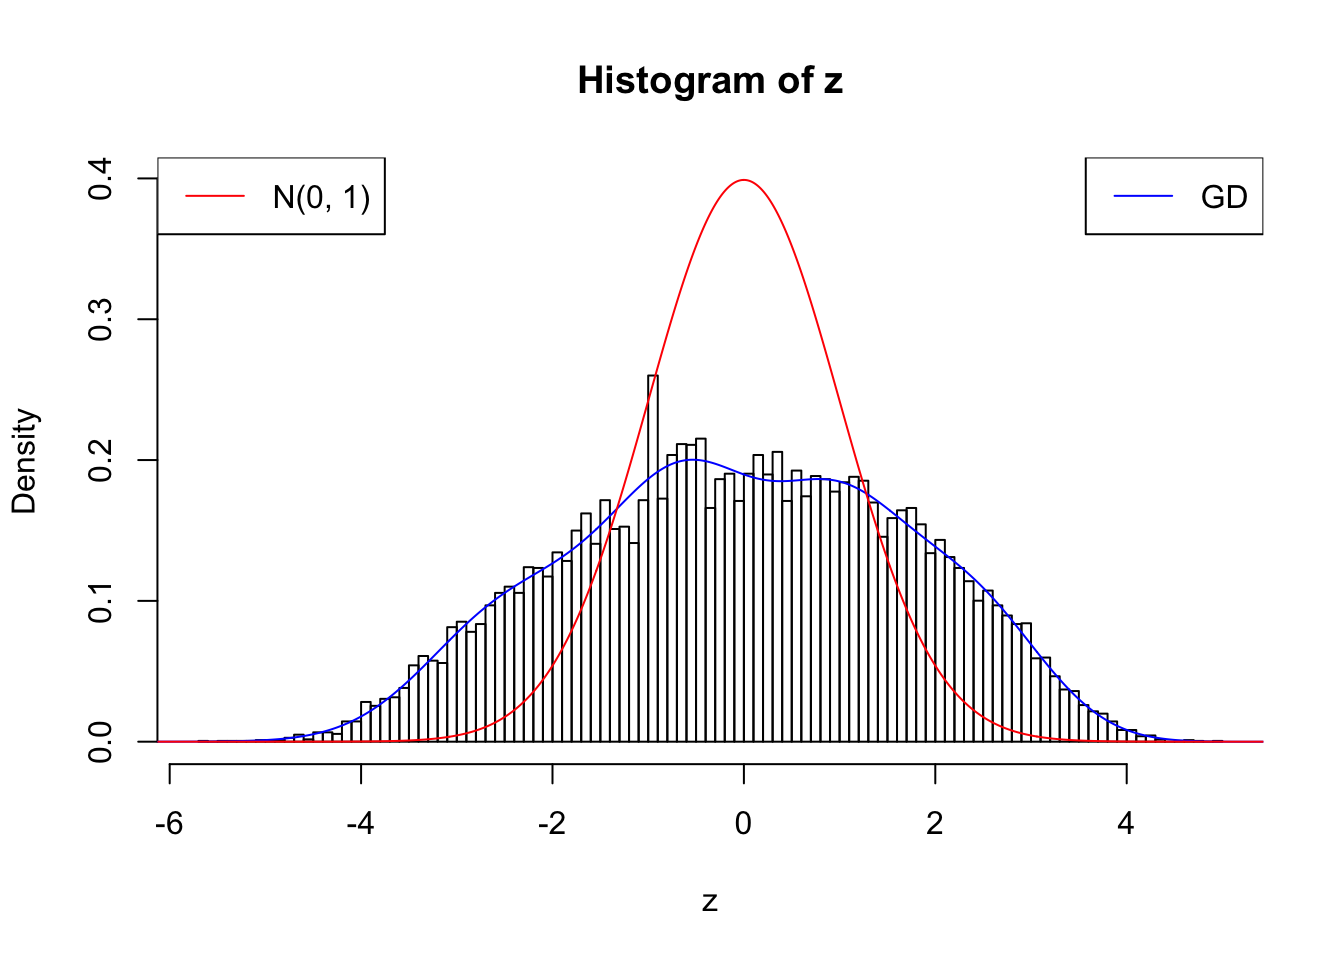
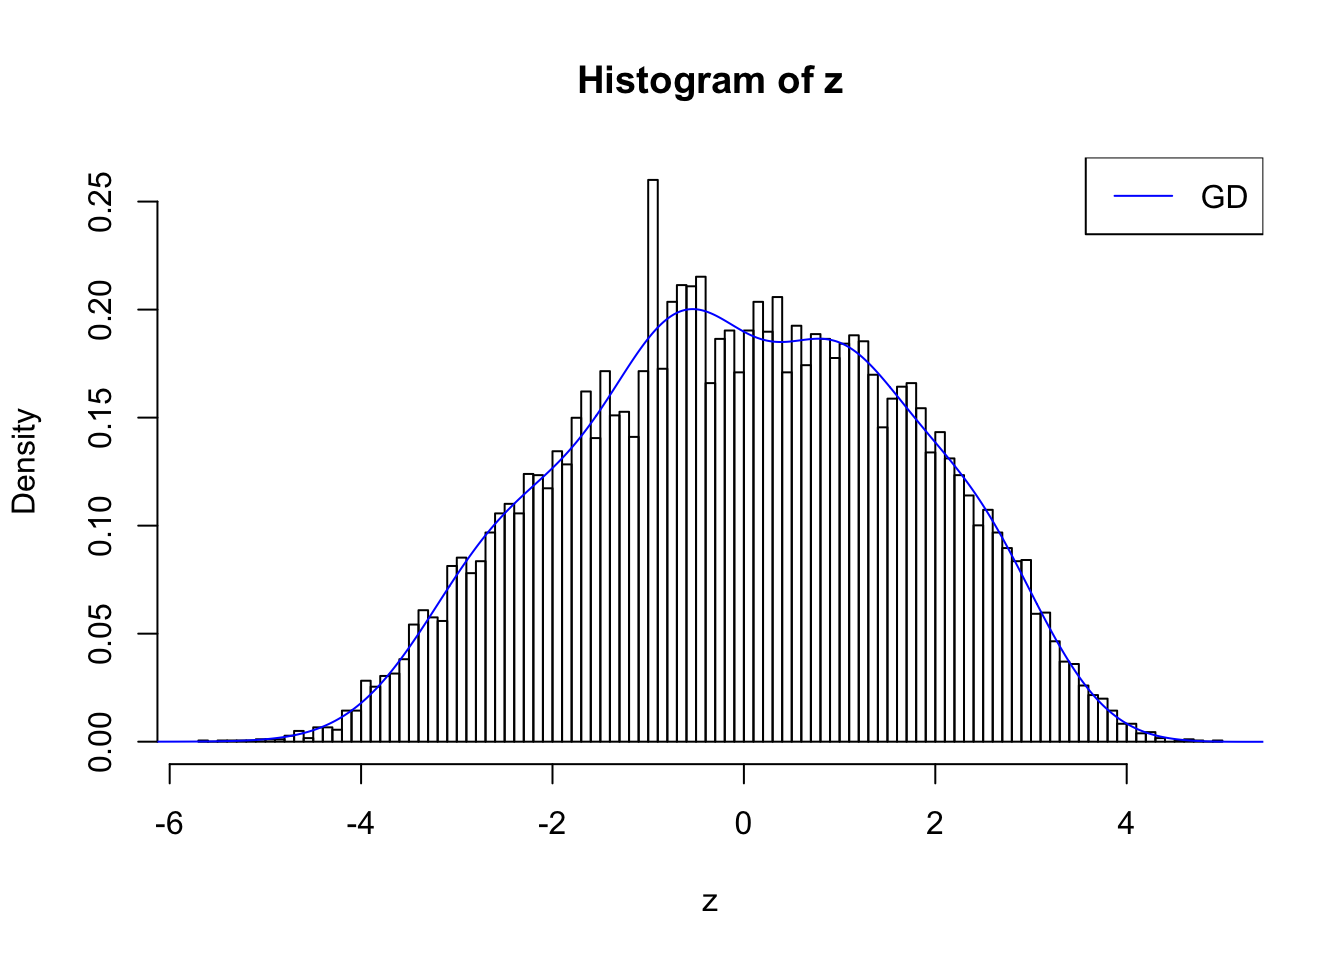
<div id="remove-two-peaks" class="section level2">
<h2>Remove two peaks</h2>
<pre class="r"><code>## Remove all singletons
counts.nonsingleton = counts[rowSums(counts) &gt; 1, ]
## Number of non-singleton genes
nrow(counts.nonsingleton)</code></pre>
<pre><code>[1] 18075</code></pre>
<pre class="r"><code>w.fit = gdfit(z, gd.ord = 10)
plot.gdfit(z, w.fit$w, w.fit$gd.ord, breaks = 100)</code></pre>
<p><img src="figure/smemo.rmd/non-singleton%20fitting%20and%20plotting-1.png" width="672" style="display: block; margin: auto;" /></p>
<pre class="r"><code>plot.gdfit(z, w.fit$w, w.fit$gd.ord, std.norm = FALSE, breaks = 100)</code></pre>
<p><img src="figure/smemo.rmd/non-singleton%20fitting%20and%20plotting-2.png" width="672" style="display: block; margin: auto;" /></p>
<pre class="r"><code>plot(ecdf(z))</code></pre>
<p><img src="figure/smemo.rmd/non-singleton%20fitting%20and%20plotting-3.png" width="672" style="display: block; margin: auto;" /></p>
</div>
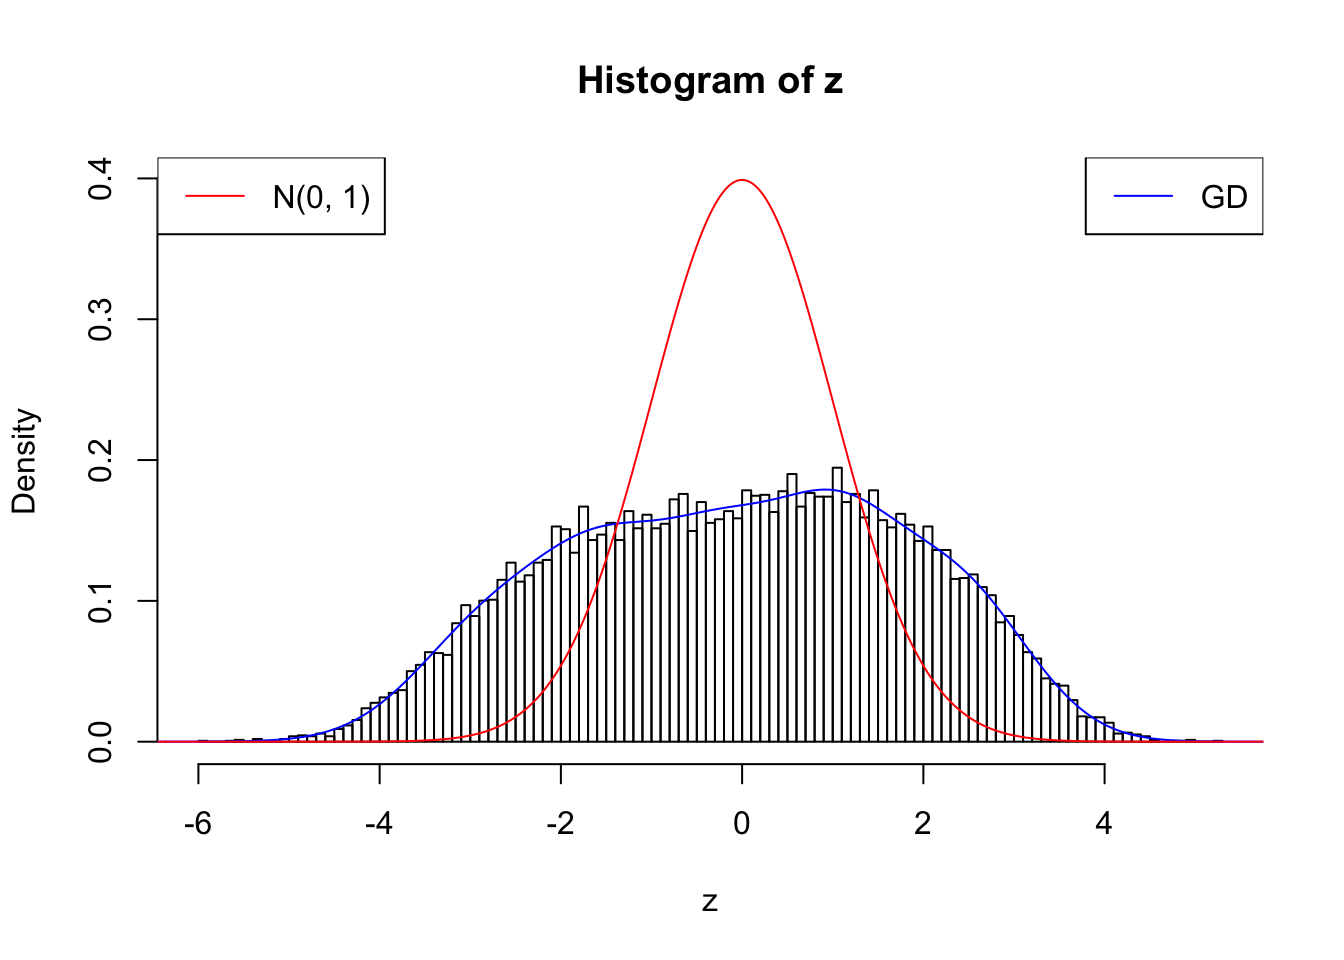
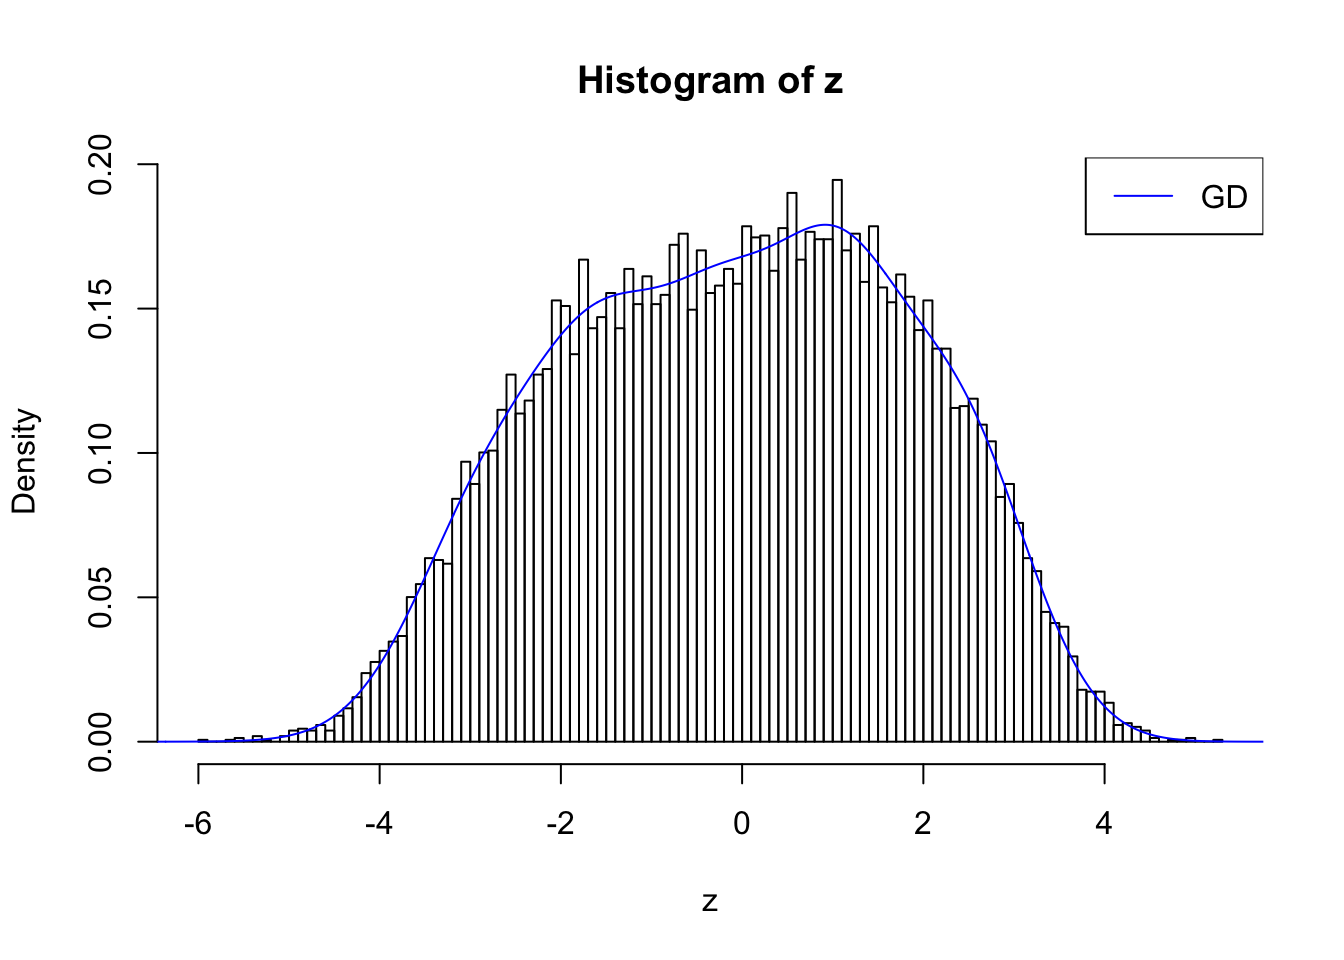
<div id="higher-expression" class="section level2">
<h2>Higher expression</h2>
<pre class="r"><code>## Remove all zeros
counts.pos = counts[apply(counts, 1, min) &gt; 0, ]
## Number of positive genes
nrow(counts.pos)</code></pre>
<pre><code>[1] 15573</code></pre>
<pre class="r"><code>w.fit = gdfit(z, gd.ord = 10)
cat(rbind(paste(0 : w.fit$gd.ord, &quot;:&quot;), paste(w.fit$w, &quot;;&quot;)))</code></pre>
<pre><code>0 : 1 ; 1 : 0.0728018367613569 ; 2 : 1.90276901242463 ; 3 : 0.487348637367052 ; 4 : 2.25733510399704 ; 5 : 0.946549908952083 ; 6 : 1.49164087236149 ; 7 : 0.902213125512891 ; 8 : 0.427623049883572 ; 9 : 0.342914618843359 ; 10 : 0.011101038914766 ;</code></pre>
<pre class="r"><code>plot.gdfit(z, w.fit$w, w.fit$gd.ord, breaks = 100)</code></pre>
<p><img src="figure/smemo.rmd/positive%20fitting%20and%20plotting-1.png" width="672" style="display: block; margin: auto;" /></p>
<pre class="r"><code>plot.gdfit(z, w.fit$w, w.fit$gd.ord, std.norm = FALSE, breaks = 100)</code></pre>
<p><img src="figure/smemo.rmd/positive%20fitting%20and%20plotting-2.png" width="672" style="display: block; margin: auto;" /></p>
<pre class="r"><code>plot(ecdf(z))</code></pre>
<p><img src="figure/smemo.rmd/positive%20fitting%20and%20plotting-3.png" width="672" style="display: block; margin: auto;" /></p>
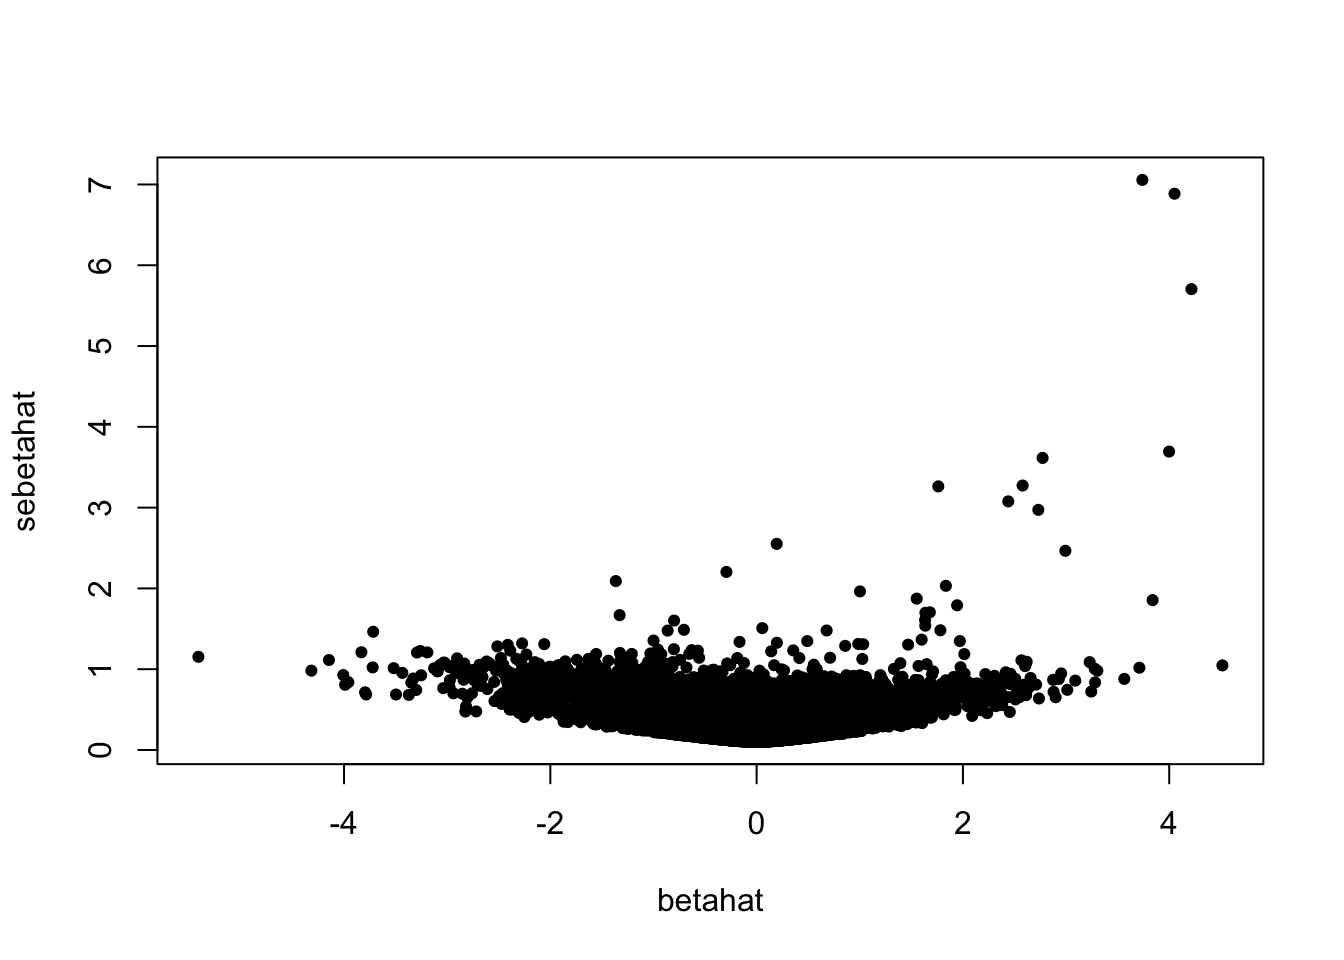
<pre class="r"><code>plot(betahat, sebetahat, cex = 0.7, pch = 19)</code></pre>
<p><img src="figure/smemo.rmd/betahat%20vs%20sebetahat-1.png" width="672" style="display: block; margin: auto;" /></p>
<pre class="r"><code>plot(betahat, z, cex = 0.7, pch = 19)</code></pre>
<p><img src="figure/smemo.rmd/betahat%20vs%20z-1.png" width="672" style="display: block; margin: auto;" /></p>
<pre class="r"><code>fit.gdash = gdash(betahat, sebetahat)
fit.gdash</code></pre>
<pre><code>$fitted_g
$pi
 [1] 1.000000e+00 2.528802e-09 2.400118e-09 2.176700e-09 1.830511e-09
 [6] 1.379624e-09 9.118214e-10 5.331526e-10 2.878238e-10 1.520977e-10
[11] 8.278542e-11 4.833395e-11 3.156007e-11 2.470504e-11 2.695689e-11
[16] 5.699028e-11 1.271587e-10 5.089537e-11 1.086289e-11 4.376792e-12
[21] 2.589195e-12 1.842740e-12 1.463606e-12

$mean
 [1] 0 0 0 0 0 0 0 0 0 0 0 0 0 0 0 0 0 0 0 0 0 0 0

$sd
 [1]  0.000000000  0.007302517  0.010327318  0.014605033  0.020654636
 [6]  0.029210066  0.041309272  0.058420132  0.082618544  0.116840265
[11]  0.165237087  0.233680530  0.330474174  0.467361059  0.660948349
[16]  0.934722118  1.321896697  1.869444237  2.643793394  3.738888474
[21]  5.287586788  7.477776948 10.575173576

attr(,&quot;row.names&quot;)
 [1]  1  2  3  4  5  6  7  8  9 10 11 12 13 14 15 16 17 18 19 20 21 22 23
attr(,&quot;class&quot;)
[1] &quot;normalmix&quot;

$w
 [1]  1.000000e+00 -5.240201e-02  1.789038e+00 -3.560324e-01  1.788218e+00
 [6] -5.932673e-01  7.470306e-01 -4.652369e-01  1.611175e-07 -1.348388e-01
[11] -1.229651e-07

$niter
[1] 3

$converged
[1] TRUE</code></pre>
<pre class="r"><code>fit.ash = ashr::ash(betahat, sebetahat)
lfsr.ash = ashr::get_lfsr(fit.ash)
sum(lfsr.ash &lt;= 0.05)</code></pre>
<pre><code>[1] 3839</code></pre>
<pre class="r"><code>fit.gdash.ash = ashr::ash(betahat, sebetahat, fixg = TRUE, g = fit.gdash$fitted_g)
lfsr.gdash.ash = ashr::get_lfsr(fit.gdash.ash)
sum(lfsr.gdash.ash &lt;= 0.05)</code></pre>
<pre><code>[1] 0</code></pre>
<pre class="r"><code>pval = (1 - pnorm(abs(z))) * 2
pval.BH = p.adjust(pval, method = &quot;BH&quot;)
sum(pval.BH &lt;= 0.05)</code></pre>
<pre><code>[1] 3087</code></pre>
</div>
<div id="session-information" class="section level2">
<h2>Session information</h2>
<!-- Insert the session information into the document -->
<pre class="r"><code>sessionInfo()</code></pre>
<pre><code>R version 3.4.2 (2017-09-28)
Platform: x86_64-apple-darwin15.6.0 (64-bit)
Running under: macOS Sierra 10.12.6

Matrix products: default
BLAS: /Library/Frameworks/R.framework/Versions/3.4/Resources/lib/libRblas.0.dylib
LAPACK: /Library/Frameworks/R.framework/Versions/3.4/Resources/lib/libRlapack.dylib

locale:
[1] en_US.UTF-8/en_US.UTF-8/en_US.UTF-8/C/en_US.UTF-8/en_US.UTF-8

attached base packages:
[1] stats     graphics  grDevices utils     datasets  methods   base     

other attached packages:
[1] Rmosek_7.1.3      PolynomF_0.94     cvxr_0.0.0.9400   REBayes_0.85     
[5] Matrix_1.2-11     SQUAREM_2017.10-1 EQL_1.0-0         ttutils_1.0-1    

loaded via a namespace (and not attached):
 [1] Rcpp_0.12.13      knitr_1.17        magrittr_1.5     
 [4] edgeR_3.20.1      MASS_7.3-47       pscl_1.5.2       
 [7] doParallel_1.0.11 lattice_0.20-35   foreach_1.4.3    
[10] ashr_2.1-27       stringr_1.2.0     tools_3.4.2      
[13] parallel_3.4.2    grid_3.4.2        git2r_0.19.0     
[16] iterators_1.0.8   htmltools_0.3.6   assertthat_0.2.0 
[19] yaml_2.1.14       rprojroot_1.2     digest_0.6.12    
[22] gmp_0.5-13.1      codetools_0.2-15  evaluate_0.10.1  
[25] rmarkdown_1.6     limma_3.34.0      stringi_1.1.5    
[28] compiler_3.4.2    backports_1.1.1   locfit_1.5-9.1   
[31] truncnorm_1.0-7  </code></pre>
</div>

<hr>
<p>
    This <a href="http://rmarkdown.rstudio.com">R Markdown</a> site was created with <a href="https://github.com/jdblischak/workflowr">workflowr</a>
</p>
<hr>

<!-- To enable disqus, uncomment the section below and provide your disqus_shortname -->

<!-- disqus
  <div id="disqus_thread"></div>
    <script type="text/javascript">
        /* * * CONFIGURATION VARIABLES: EDIT BEFORE PASTING INTO YOUR WEBPAGE * * */
        var disqus_shortname = 'rmarkdown'; // required: replace example with your forum shortname

        /* * * DON'T EDIT BELOW THIS LINE * * */
        (function() {
            var dsq = document.createElement('script'); dsq.type = 'text/javascript'; dsq.async = true;
            dsq.src = '//' + disqus_shortname + '.disqus.com/embed.js';
            (document.getElementsByTagName('head')[0] || document.getElementsByTagName('body')[0]).appendChild(dsq);
        })();
    </script>
    <noscript>Please enable JavaScript to view the <a href="http://disqus.com/?ref_noscript">comments powered by Disqus.</a></noscript>
    <a href="http://disqus.com" class="dsq-brlink">comments powered by <span class="logo-disqus">Disqus</span></a>
-->


</div>
</div>

</div>

<script>

// add bootstrap table styles to pandoc tables
function bootstrapStylePandocTables() {
  $('tr.header').parent('thead').parent('table').addClass('table table-condensed');
}
$(document).ready(function () {
  bootstrapStylePandocTables();
});


</script>

<!-- dynamically load mathjax for compatibility with self-contained -->
<script>
  (function () {
    var script = document.createElement("script");
    script.type = "text/javascript";
    script.src  = "https://mathjax.rstudio.com/latest/MathJax.js?config=TeX-AMS-MML_HTMLorMML";
    document.getElementsByTagName("head")[0].appendChild(script);
  })();
</script>

</body>
</html>