Contact:
Public
Private
Official Office Hours:
Room: 1.64
Friday: 13:00-14:00 & 17:00-18:00
16 September 2016
Contact:
Public
Private
Official Office Hours:
Room: 1.64
Friday: 13:00-14:00 & 17:00-18:00
Introduce course motivation, goals, plan, and expectations/assessment
Introduce collaborative & reproducible data analysis
Setup computational research environment
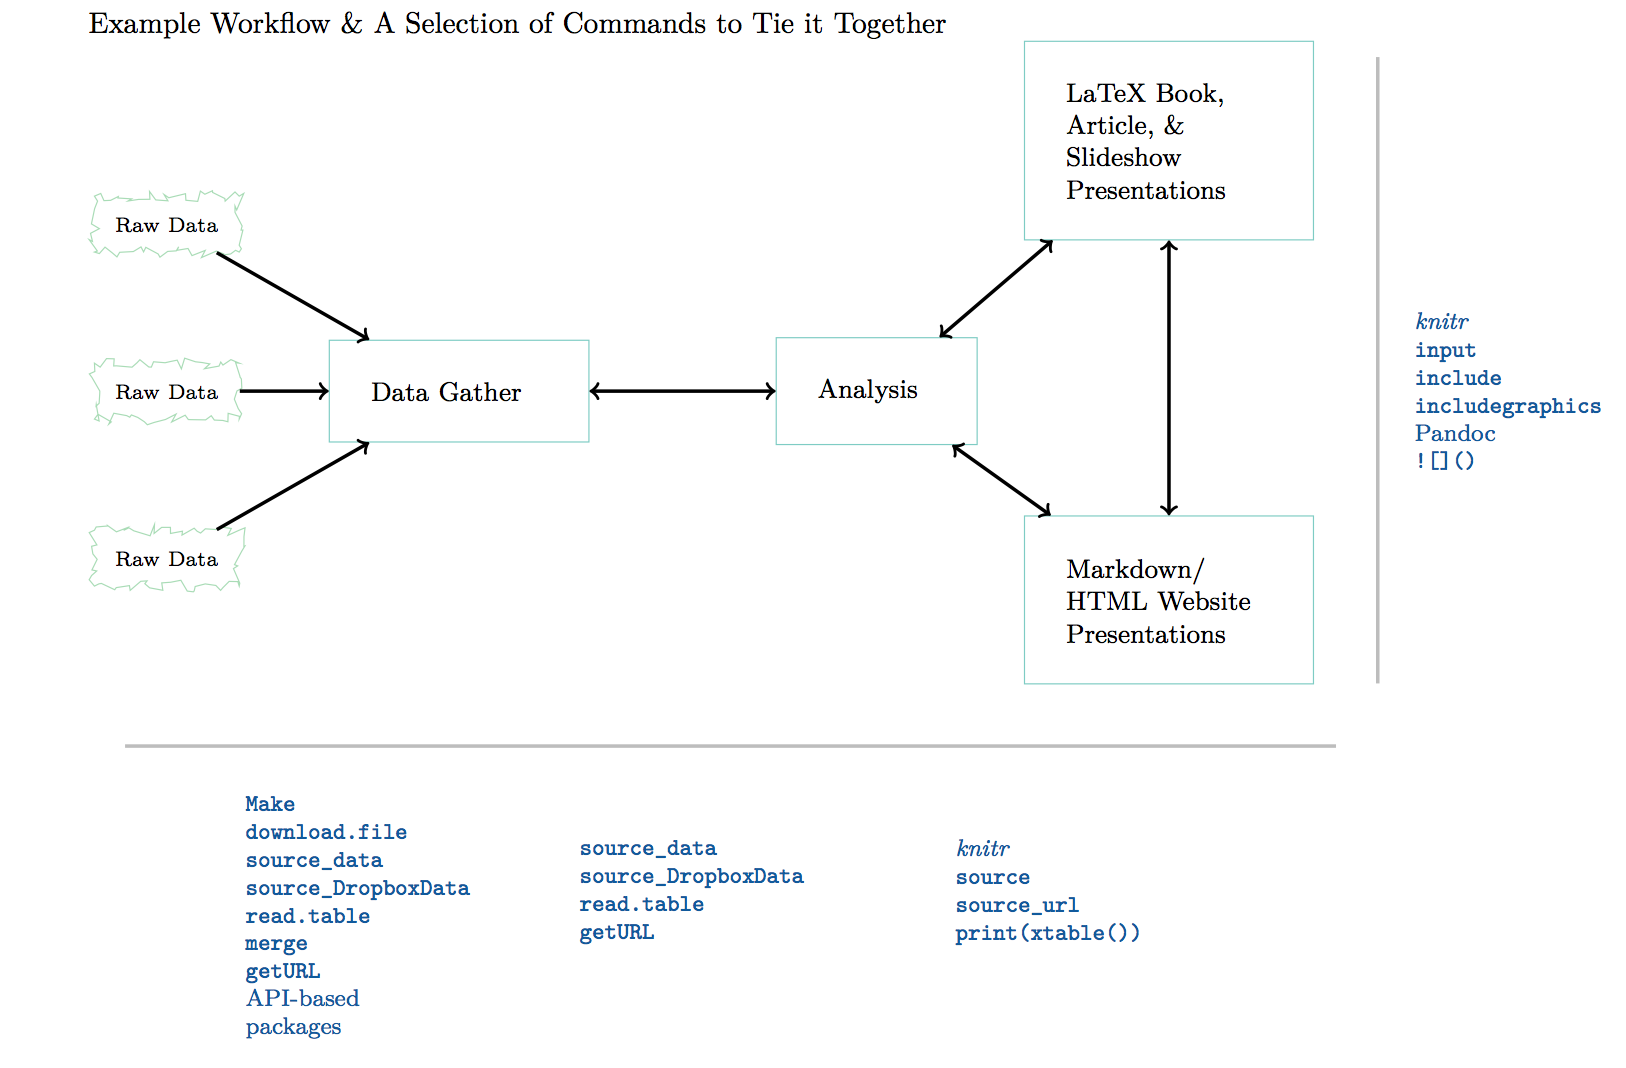
Collaboratively and reproducibly:
Gather and clean social data
Analyse it to draw informed descriptions/inferences
Present results in a variety of mediums
Learn how to actually do data analysis using best practices
We are going to use ugly real-world data, not pristine training data sets.
Use advanced computational tools to do data munging.
Skills needed to do original quantitative research for your thesis.
State-of-the-art tools needed for future high-level academic research.
Take advantage of new data sources.
Avoid effort duplication.
Make your research reproducible.
Present your results to multiple forums.
Government agencies are increasingly adopting the technologies and methods of open data science.

Public data is increasingly accessible.
Governments rely on data analysis for evidence based decision-making.
Tools of open data analysis enable better use of data within and between government actors.
Governments can take advantage of analyses done by third parties.
They are also sharing and collaboratively developing code; reducing development costs and improving applications.
Example: version control to increase engagement with the legislative process.
NGO's are becoming increasingly data-oriented and need people with skills to handle and analyse this data.
Ex. Former MPP-E1180 student Arndt Leininger recently co-founded CorrelAid to assist NGOs with data analysis.
Data analysis and R programming skills in particular are highly valued in businesses such as finance and management.

Research is collaborative (even if you don't know it).
Need tools and shared best practices to enable effective collaboration between explicit research partners.
Need tools and shared best practices to enable collaboration between researchers who are not explicitly working together often in unexpected ways.
Avoids effort duplication
Enables cumulative knowledge development
Tools for collaboration tend to enhance reproducibility.
Really reproducible research (Peng 2011, 1226):
the data and code used to make a finding are available and they are sufficient for an independent researcher to recreate the finding.
In practice reproducibility is enhanced by literate programming where the data, analysis, and presentation of the results are 'weaved' or 'knitted' together.
Reproducibility: an independent study makes the same findings using the same data and code as the original researchers.
Replicability: an independent study makes the same conclusions as the original using other data, code, and even methods, i.e. independent verification.
''A study can be reproducible and still be wrong'' Peng 2014.
E.g. a finding that is statistically significant in one study may remain statistically significant when reproduced using the original data/code, but replication studies are unable to find a similar result.
The original finding could just have been noise.
Replication is the ''ultimate standard'' for judging scientific claims (Peng 2011).
Reproducibility
Enhances replication (other researchers can understand how an analysis was actually done)
Is a minimum standard for judging scientific claims when replication is not possible.
Reproducibility helps avoid effort duplication:
Others don't waste time:
Gathering data that has already been gathered.
Discovering procedures that have already been discovered.
Reproducibility also makes it possible to find and correct errors.
Translation errors in the World Values Survey.
Data errors in research on intestinal worm treatment and school attendance.
L'Affaire LaCour: data fabrication discovered.
Data errors can cause spurious findings that ultimately waste researchers time, because they try to explain 'wrong' findings.
Higher research impact
Reproducible research is likely to be more useful for other researchers. They can use your data and learn from your code and methods.
More use more impact (e.g. citations)
Better work habits
Thinking about reproducibility from the beginning makes your files better organised and your work is better documented.
This allows you to build on your own work more effectively.
This lecture is created using RMarkdown. It allows me to create both PDF and HTML slides.

Lecture file structure
Document Everything!
Everything is a (text) file.
All files should be human readable.
Explicitly tie your files together.
Have a plan to organise, store, and make your files available.
Introductory-level statistics
Basic descriptive statistics (e.g. data types, ways of describing distributions)
Basic inferential statistics: (significance testing, linear regression)
Exposure to statistics software (e.g. SPSS, STATA)
Knowledge of particular software or computer programming is not expected
Patience
Part I: Motivation and Getting Started
Introduction to the Course
Introduction to the R Programming Language
Files, Files Structures, Version Control, and Collaboration
Part II Markup Languages and Literate Programming
Introduction to Markup Languages and Literate Programming (1)
Introduction to Markup Languages and Literate Programming (2)
Part III: Data Gathering, Trasformations, and Analysis
Automatic Data Gathering via Curl, API Packages + Cleaning
Automatic Data Gathering via Web Scraping
Statistical Modelling with R
Part IV: Communicating Results from Statistical Analyses
Automatic Table Generation and Static Visualisation
Dynamic Visualisation
Part V: Collaborative Research Project
~ 1 hour lecture
~ 1 hour seminar
Apply what we learned in the lecture/readings to complete tasks with no set pattern to copy by rote.
Pair programming: work together with others to achieve these goals.
Documentation: document your work with Git/GitHub.
Your seminar work should be reproducible.
It should be useful to your future self and others.
This year the course is broken into 8 classes that are each three hours long.
Today we will do:
1 hour lecture on topic 1 (Course Introduction),
1 hour seminar on topic 1,
1 hour lecture on topic 2 (Intro to R).
Next class we will do:
1 hour seminar on topic 2 (Intro to R),
1 hour lecture on topic 3 (Files, File Structures, Version Control),
1 hour seminar on topic 3.
16, 23, 30
7, 21
18, 25
2
3 Pair Assignments (7 October, 28 October, 11 November)
Collaborative Research Project (Presentation: 2 December, Website/Paper: Exam Week)
Attendance & Active Participation
No traditional midterm or final exam
All assignments must be developed and submitted electronically on GitHub.
Late assignments: -10% every day that the assignment is late.
All assignments must be completed in pairs.
Each pair member receives the same score
Exception: very large discrepancy in contributor statistics

All assignments must be reproducible.
Due: Midnight on the due date.
More details will be given on the specific pair assignments/research project in future classes.
Usual Hertie Rules for attendance (examination rules §4)
Participation:
Traditional Participation, e.g. engaging in class discussions, doing readings
Non-Traditional Participation: pair programming in seminars, document your seminar work on GitHub, pull request to the course repository (syllabus/lecture slides) and other groups' projects
https://github.com/HertieDataScience/SyllabusAndLectures
Syllabus: README.md
The syllabus will be updated. Check regularly.
Lecture Slides: Links in Online Syllabus or LectureSlides/
Usually accessible as both HTML (recommended) or PDF.
Slides will be optimized for the web.
Core Texts
Gandrud, Christopher. 2015. Reproducible Research with R and RStudio. 2nd Edition. Chapman & Hall/CRC Press, Oxford. (RRRR)
Crawley, Michael J. 2005. Statistics: An Introduction Using R. John Wiley and Sons Ltd., Chichester.
Both are available in the library.
Other readings generally available online (see syllabus) or I will make a copy available.
If you have general questions, please post them to the GitHub Issue Pages:
https://github.com/HertieDataScience/SyllabusAndLectures/issues
Includes answers to questions asked in previous semesters.
Find course materials and open lecture slides.
Meet each other, get idea of background.
Setup software (all software is free).
Make sure you have a modern web browser, e.g. Chrome.
Setup Git/GitHub for version control, collaboration, and remotely storing your files.
Set up (free) GitHub account: https://github.com/join.
Install GitHub application: https://desktop.github.com/.
Install software:
R (version 3.3.1): http://cran.rstudio.com/
RStudio (dev build): http://www.rstudio.org/download/daily/desktop/
Make sure that you can install R packages:
# Install the ggplot2 package
install.packages('ggplot2')

# Check to see if it loads properly
library(ggplot2)

ggplot(mtcars, aes(hp, mpg)) + geom_point()
ggplot(mtcars, aes(hp, mpg)) + geom_point()

Install a LaTeX distribution. Creates well formatted PDF versions of your presentation documents.
Windows: http://miktex.org/download
This is a large download, so maybe do it in your spare time.
Play around with the software (especially RStudio)